1. Introduction
The Jožef Stefan Institute (JSI) has been operating the TRIGA Mark II research reactor since 1966. In 1991 the JSI TRIGA reactor was reconstructed [1] by upgrading the reactor to the pulse mode of operation. A pulse is initiated from a critical core at low power using the transient rod with a fully inserted air follower. By pneumatically ejecting out the transient rod the reactor becomes prompt supercritical in a short time, and the power begins to increase. Since the fuel is a homogeneous mixture of ZrH and uranium the reactor power is promptly decreased due to the prompt negative temperature reactivity coefficient of the fuel, which makes the reactor establish a new equilibrium state quickly. The peak power of the pulse reaches some hundreds MW, and the total released pulse energy is relatively small, typically a few MJ, due to the short pulse time (of the order of several 10 ms) [2].
The 250 kW JSI TRIGA Mark II research reactor is a very well characterized reactor in terms of knowledge of neutron and gamma flux fields [[3], [4], [5], [6], [7]]. A vital phase in developing nuclear instrumentation detectors and associated electronic data acquisition systems is experimental testing and qualification in a well-characterized and representative radiation field in a reference irradiation facility. Moreover, pulse operation can be used for experimental validation of reactor transient modelling, for short and intense irradiations, detector response testing, for educational purposes and demonstration of inherent safety and measurement of the prompt negative temperature reactivity coefficient of the reactor.
In this paper, a pulse experimental model is presented using measured data, theoretical and computational validation in order to support future pulse experimental campaigns. The data from all pulse experiments performed at the TRIGA reactor at JSI have been collected, analysed and are publicly available on the reactor webpage http://trigapulse.ijs.si/ [8]. Theoretical predictions according to Fuchs-Hansen (FH) and Nordheim-Fuchs (NF) models and numerical calculations using computational program Improved Pulse Model (IPM) are compared to experimental data. Derivation of the underlying equations of the models is included, since they are not readily given in standard reactor physics textbooks. Theoretical predictions are derived from the equations of the point reactor kinetics using five assumptions and have the same pulse physical parameters (maximum power, total released energy and full width at half maximum). Based on the theoretical model, an improved computational model IPM is developed, where the following principles are used: delayed neutrons with six-group point kinetics equations, the temperature dependence of temperature reactivity coefficient of fuel and specific heat, final travel time of the transient control rod from the reactor core, which depends on reactivity step, and extraction of heat from the fuel. Each contribution is evaluated and presented.
FH and NF models are also used for the evaluation of uncertainties in pulse physical parameters due to uncertainties in reactor physical parameters (inserted reactivity, delayed neutron fraction, prompt neutron lifetime and effective temperature reactivity coefficient of fuel). In addition correlation of physical parameters in theoretical predictions is analysed.
The paper is structured as follows. In the first chapter, the historical review of pulse mode operated facilities is presented, followed by the description of the TRIGA Mark II reactor at the Jožef Stefan Institute. In the third chapter, a negative temperature reactivity coefficient of fuel, theoretical models (FH and NF), program PULSTRI, IPM and the comparison between theoretical models and IPM are presented. In the fourth chapter sensitivity and uncertainty analysis is performed. In the last chapter, the theoretical models and IPM are compared with experimental values, and comparison is made for two different core configurations.
2. Historical review
TRIGA type reactors are the most common type of research reactors in the world (described in section 3). In addition to TRIGA reactors several other facilities also operated in a pulse mode. The following summarized most of these facilities and their most important features.
For the first operating pulsed reactor TOPSY (Los Alamos; 1948–1955) the goal was to provide fast-neutron data for checking the powerful and simplified computational techniques that relied upon high-speed machines at that time [9]. The critical assemblies GODIVA I, II, III and IV (Los Alamos; from 1951, 1975, late 1950s, early 1960) were used for criticality and neutron spectral studies [9,10]. The Special Power Excursion Reactor Test program (SPERT) I and II (by the U. S. Atomic Energy Commission; from 1955 to 1960) was used for performing a series of tests focusing on the safety of nuclear reactors [11]. The goal of Pu sphere JEZEBEL (Los Alamos; 1954–1977) was to check weapons calculations and to provide neutronic information about uranium 233U and plutonium [9]. MARS (Los Alamos; from late 1950s) was used for neutronic and core optimization studies, to study pulsed, gaseous-core [9]. The Kiwi-TNT was purposely destroyed to investigate a severe reactivity accident among the following reactors KIWI A, B1, B4 and TNT (Los Alamos; 1959–1968) to validate the required accident analyses, thereby increasing confidence in yield calculations [9]. Health Physics Research Reactor (HPRR) (Oak Ridge National Laboratory) was used for the furtherance of the health physics and biomedical research [12]. “The mission of the Impulse Graphite Reactor (IGR) (Kurchatov; from 1961) was focused on studying nuclear reactor accidents and fuel and material behaviour in advanced reactor systems; later this reactor had a key role in the development of LMFBR systems” [13]. PULSTAR (state University of New York at Buffalo; from 1962) [14] was used primarily for radioisotope production. CABRI (Cadarache; from 1963) experimental reactor was dedicated to realize tests representative of PWR accidental conditions. The key feature of the CABRI core was its reactivity injection system where a 3 $ reactivity injection could be reached, resulting in a power burst from 100 kW to approximately 20 GW in a few ms [15]. At Transient Reactor Testing Facility (TREAT) (Idaho; 1959–1994 and restarted in 2017 [16]) the majority of research was about testing fast reactor fuels. The largest achievable peak power and energy deposition was 19 GW and 2.9 GJ, respectively [17]. Sandia Pulse Reactor (SPR), II, III and IIIM (Sandia National laboratories; from 1961, 1967, 1975, 1995) have been used for research and development of nuclear and non-nuclear weapon systems, advanced nuclear reactors, reactor safety, simulation sources and energy related programs [18]. The main feature of the Annular Core Pulse Reactor (ACPR) (Sandia National Laboratories; 1967–1977), which distinguishes it from other TRIGA reactors was the large dry irradiation cavity at the centre of the core [18]. Power Burst Facility (PBF) (Idaho National Laboratory; from 1972) was primarily used for evaluation of the consequences and hazards of very rapid destructive accidents in reactors representing the entire range of current nuclear technologies as applied to power generation, propulsion, and testing. It was also used to carry out detailed studies of non-destructive reactivity feedback mechanisms in the short-period domain [19]. “Nuclear Safety Research Reactor (NSRR) (Tokai in Japan; from 1975) was built with the original mission to investigate fresh fuel specimens and later also to test pre-irradiated fuel specimens. The maximum core power in pulse mode operation was 23 GW” [13]. “Bystry Impulsny Graphitovy Reaktor (BIGR) (Russia; from 1977) was classified as a military reactor, where the maximum core energy from a pulse was 300 MJ while maximum reactor power from a pulse was 70 GW” [13]. “Annular Core Research Reactor (ACRR) (New Mexico; 1978) subjected various materials to transient or steady-state gamma and neutron irradiation, including certification of weapons and electronic systems, production of medical radioisotopes” [13]. Solution High-Energy Burst Assembly (SHEBA) (Los Alamos; from 1980) was used for proof-testing criticality-accident-detection systems and for investigating solution reactor prompt bursts to better understand solution criticality accidents [9]. Supercritical Uranium Assembly (SKUA) (Los Alamos; 1980s-1996) was designed to produce high-fluence pulses of thermal or fast-energy neutrons [9]. VIPER (United Kingdom) was designed as a research reactor producing very intense pulses of neutron and gamma radiation. It utilised the Doppler effect in uranium 238U to provide a large part of the inherent temperature coefficient, and the core was designed so that its composition could be changed, thus varying both the neutron lifetime and the Doppler effect [20]. Transient Experiment Critical Facility (TRACY) (Tokai Research Establishment of the Japan Atomic Energy Research Institute, nowadays Japan Atomic Energy Agency; 2001) was used for the simulation of criticality accidents in a fuel processing facility, such as a spent-fuel reprocessing plant. The maximum excess reactivity of TRACY was 3 $, and the integral power in an experiment was limited to 9 kWh (32 MJ) [21]. KUKLA (Lawrence Radiation Laboratory) was similar to Godiva [22]. FRAN (Lawrence Radiation Laboratory) presented an attempt to maximize the attainable burst yield in a pure uranium assembly [22]. White Sands Missile Range (WSMR) (developed by Kaman Nuclear) fast burst reactor core was similar to HPRR and the core was mounted on a small stand similar to that of Godiva II or SPR I [22]. SUPER KUKLA (from 1964) reactor was designed to serve as a prompt burst irradiation source for a wide variety of samples that could be exposed externally or in a large internal cavity [22].
The operation of the above-described devices was based on reactivity feedbacks. Reactivity feedback is a phenomenon that occurs when an initially applied reactivity changes the state of the system, generally via a change in the neutron population and subsequent effects (e.g. changes in fission rate, temperature, dimensions, etc.). This change in the reactor causes a change in reactivity, which in turn feeds back to and modifies the original reactivity. Reactivity feedback is inherent if its occurrence is based on an unavoidable and thus totally reliable physical phenomenon. Feedback is called prompt if it directly follows the changing fuel temperature. The rise of the fuel temperature during a transient is due to the energy produced directly or indirectly in fission reactions [23].
Phenomena contributed to reactivity feedback are Doppler effect, thermal spectrum hardening and thermal expansion of the fissile system and thus enhanced neutron leakage. The Doppler's phenomenon is related to broadening of the resonances for neutron absorption. In low enriched fuel, this typically leads to increased absorption in 238U resonance, thus decreasing reactivity. In thermal spectrum hardening the peak of the thermal neutron spectrum is shifted to higher energies, where the fission to capture ratio on 235U is smaller (see Fig. 10), thus reducing reactivity (see Fig. 9).
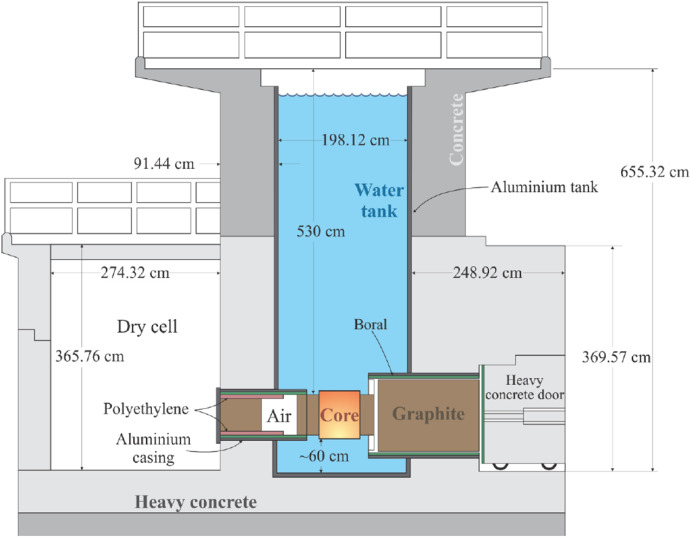
 Fig. 1. TRIGA Mark II reactor side view [24].
 Fig. 2. Transient control rod [24].
 Fig. 3. Schematic of the reactor core TRIGA Mark II (not to scale), highlighting the position of the transient control rod [24].
 Fig. 4. Geometrical model (xy view) of the TRIGA research reactor presenting graphite of the thermalizing and thermal column.
 Fig. 5. Geometrical model (xz view–top view) of the TRIGA research reactor presenting the rotary groove in the graphite reflector with 40 irradiation locations and the radial and tangential beam ports.
 Fig. 6. Criticality core configurations (133), schematic top view with six concentric rings.
 Fig. 7. Case 1 differences (Δ RR) for total reaction rates (fission, capture and elastic scattering) calculated in all fuel elements within the core 133 for two energy groups (gr.) and for different temperatures (T) are given in [%] with regards to the value at the reference state (T = 294 K).
 Fig. 8. Case 2 differences (Δ RR) for total reaction rates (fission, capture and elastic scattering) calculated in all fuel elements within the core 133 for two energy groups (gr.) and for different temperatures (T) are given in [%] with regards to the value at the reference state (T = 294 K).
 Fig. 9. Case 3 differences (Δ RR) for total reaction rates (fission, capture and elastic scattering) calculated in all fuel elements within the core 133 for two energy groups (gr.) and for different temperatures (T) are given in [%] with regards to the value at the reference state (T = 294 K).
 Fig. 10. Thermal reference lethargy spectrum (Flux (i)/ln(E(i)/E(i-1)) at temperature 294 K (magenta), thermal lethargy reference spectrum at 700 K (red) and thermal lethargy spectrum at 700 K in the case where the adjusted cross section for thermal scattering h/zr is not considered (green), i.e. case 3 (up). Neutron reproduction factor versus neutron energy for fuel (bottom). (For interpretation of the references to color in this figure legend, the reader is referred to the Web version of this article.)
It is important to note that it is stated in Ref. [23] that there is only one prompt feedback effect in thermal and fast reactors, i.e. the Doppler reactivity effect. The corresponding feedback loop is as short as possible since the Doppler broadening of resonances coincides with the dissipation of the kinetic energy of the fission products in the fuel. In reactors or critical assemblies featuring homogeneous mixture of fissile material and the moderator, the spectrum shift effect occurs instantaneously.
3. Description of the JSI TRIGA MARK II
The TRIGA research reactor at JSI is a TRIGA Mark II reactor that can operate at a steady-state power of 250 kW or up to 1 GW in pulse mode. The reactor is designed as a lightwater pool-type and uses natural convection for cooling. The reactor core is located at the bottom of an open aluminum tank with a height of 6.25 m and a diameter of about 2 m (see Fig. 1) and is filled with demineralized water. It has a cylindrical shape and consists of 91 positions that can accommodate fuel rods, neutron sources, irradiation channels, or control rods (see Fig. 3). The core consists of six concentric rings, labeled A, B, C, D, E, and F, with capacities of 1, 6, 12, 18, 24, and 30 positions, respectively. The spacing between adjacent positions within each ring is uniform. Each position corresponds to a hole in the upper and lower aluminum grid plates that enclose the reactor core. In addition to openings for fuel rods, neutron sources, irradiation channels, and control rods, the grid plates also contain smaller openings for reactor instrumentation and two larger triangular holes that can accommodate either three fuel elements or a triangular irradiation channel. The core is surrounded by a graphite reflector enclosed in an aluminum casing [24].
The fuel elements in the TRIGA Mark II reactor have a cylindrical shape and are made of UZrH1.6 fuel. These fuel elements are clad with stainless steel. The reactor is equipped with four control rods, three of which contain boron carbide (B4C) as the absorbing material, followed by the fuel material upon withdrawal. The design of the transient control rod is similar to the other control rods, except that it has an empty tube (void) following the absorbing material (see Fig. 2). This unique structure results in an asymmetry in the reactivity worth curve of the transient control rod, as shown in Fig. 22 [24].
During pulse experiments, a pneumatic system is used to eject the inserted transient control rod from the reactor core to a predetermined upper position. The height of the pneumatic transient rod drive mechanism cylinder, located above the reactor core, is adjusted to control the ejection height of the transient control rod. In order to perform well-defined pulse experiments, calibrated instrumentation is essential to accurately monitor reactor performance and determine the excess reactivity of the core. The excess reactivity of the core is determined from the reactivity worth curves for each of the control rod [25]. The value curves of the control rods are determined by the rod-insertion method [26,27].
4. PHYSICS OF pulse mode
The TRIGA Mark II research reactor at the JSI can operate in pulse mode. In pulse mode a transient control rod is quickly ejected out of the reactor core by pneumatic mechanism. After ejecting (in a few tens of ms) reactor becomes prompt supercritical and the power begins to increase exponentially. Two reactivity feedback physical mechanisms ensure the safety of such an experiment. The first one is the Doppler effect. With increasing power, the higher fuel temperature leades to increaseed absorption of neutrons in uranium (238U), and the second one is the thermal spectrum hardening effect [23]. Both phenomena contribute to the prompt negative temperature reactivity coefficient (PNTRC) of fuel, leading to the instant decrease in reactivity and, consequently, power decreases. Thermal expansion of the fuel was also considered, but since any expansion mainly fills the gap between the cladding, the effect on reactivity is small. The prompt negative temperature reactivity coefficient of the fuel is one of the most important safety mechanisms in the TRIGA reactor. The magnitude of the PNTRC is relatively difficult to predict, especially if the core is heterogeneous. The reactivity effect depends on the type of fuel elements used in the core, their burnup and the core loading pattern [28]. Thus the temperature reactivity coefficient of fuel can only be obtained by performing detailed reactor calculations. For this reason, we used the Serpent [28], Monte Carlo neutron transport code which had already been validated for TRIGA steady-state calculation [29], to calculate the temperature reactivity coefficient of fuel. The results are presented in the next section.
4.1. Negative temperature reactivity coefficient of fuel
The Serpent 2 code (Serpent 2.1.27) is used for calculating reactivity effect in full TRIGA 3-D geometry, by considering the fuel temperature change for core configuration 133 which is described in the ICSBEP Handbook [30]. Serpent TRIGA model with radial and tangential beam ports is presented in Fig. 4, Fig. 5. Benchmark core 133 (Fig. 6) is filled only with standard fuel elements of 20 wt % enrichment and 12 wt % uranium concentration with the main physical characteristics given in Table 1.
Table 1. Main physical characteristics of standard TRIGA fuel used in the calculations.
| Fuel rod component outer radius (cm) | Zr rod | 3.17500E-01 |
| Fuel | 1.82245 | |
| Air | 1.82626 | |
| Cladding | 1.87706 | |
| Fuel density (g/cm3) | 6.045 | |
| Fuel material (atom density [b−1]) | 235U | 3.68008E-04 |
| 238U | 1.46249E-03 | |
| 1H | 5.52527E-02 | |
| 90Zr | 1.77659E-02 | |
| 91Zr | 3.87428E-03 | |
| 92Zr | 5.92196E-03 | |
| 94Zr | 6.00136E-03 | |
| 96Zr | 9.66843E-04 | |
| Water density (g/cm3) | 0.997250 | |
| Cladding (SS type 304) density (g/cm3) | 7.88890 | |
| Zr rod density (g/cm3) | 6.49000 |
The temperature reactivity coefficient of fuel (α) is calculated using the Serpent 2 code and ENDF/B-VII.0 continuous-energy nuclear data library [31]. Serpent calculations are performed with a computer cluster node (Intel Xeon 6240 R CPU @ 2.40 GHz) with 2 × 24 cores, using 1010 batches of 100 000 neutrons and 10 cycle skips. The statistical 1σ uncertainty for the obtained multiplication factor (keff) is about 10 pcm (parts per 100 000). The cross-sections for standard TRIGA fuel (for materials given in Table 1), the thermal cross-sections of hydrogen in zirconium hydride (usually the following ZAI (nuclide identifier) is given in ace library: h/zr) and thermal cross-section of zirconium in zirconium hydride (zr/h) are considered in the calculations. Thermal scattering data were taken from the ENDF70SAB file in ACE format, which is also part of the ENDF/B-VII.0 library. Since the h/zr is tabulated for the following temperatures (296 K, 400 K, 500 K, 600 K, 700 K, 800 K) in the given ACE file and the cross-sections (nuclides) are given for the following temperatures (294 K, 600 K and 900 K), the pre-processing utility program for creation of temperature-dependent libraries, makxsf [32], was used to make appropriate microscopic cross-sections (nuclides) at the following temperature: 400 K, 500 K, 700 K and 800 K.
The results of the calculated temperature reactivity coefficient of fuel are presented in Table 2 for TRIGA 3D model (reactor model specification were taken from Ref. [29]), where it can be seen that the temperature reactivity coefficient of fuel is temperature-dependent. In our calculations, the fuel temperature was increased using an average fuel temperature for all fuel elements in the core from 294 to 800 K in the following temperature steps: 294 K, 400 K, 500 K, 600 K, 700 K, and 800 K. For each temperature step the multiplication factor k∞ was calculated since we were only interested in the multiplication factor difference for each temperature change. It is important to note that fuel density and water density were kept constant during the fuel temperature increase, and all other temperatures of all other materials in the core (Zr rod, cladding and water) are left constant at 294 K.
Table 2. Calculated k∞ using ENDF/B-VII.0 library, corresponding reactivity (ρ∞=(k∞-1)/k∞) and calculated temperature reactivity coefficient of fuel in dependence of temperature (T) for standard TRIGA fuel. Additional uncertainties listed in the table are the 1 σ statistical uncertainties of the calculated multiplication factor δk∞ and corresponding reactivity δρ.
| T [K] | k∞ ± δ k∞ | ρ ± δ ρ | α ± δ α [pcm/K] |
|---|---|---|---|
| 294 | 1.01098 ± 0.00010 | 0.01086 ± 0.00020 | |
| 400 | 1.00394 ± 0.00010 | 0.00392 ± 0.00020 | −6.54 ± 0.38 |
| 500 | 0.99477 ± 0.00011 | −0.00526 ± 0.00022 | −9.19 ± 0.42 |
| 600 | 0.98525 ± 0.00011 | −0.01497 ± 0.00020 | −9.71 ± 0.42 |
| 700 | 0.97594 ± 0.00010 | −0.02465 ± 0.00020 | −9.68 ± 0.40 |
| 800 | 0.96668 ± 0.00010 | −0.03447 ± 0.00020 | −9.81 ± 0.40 |
The temperature reactivity coefficient is affected by two main physical mechanisms, i.e. Doppler broadening and thermal neutron spectrum hardening. In the following section a brief discussion on spectrum hardening and the Doppler effect is presented.
4.1.1. Detailed analysis of Doppler effect and spectrum hardening
In order to quantify the effect of Doppler broadening and spectrum hardening, we calculated fission, capture and elastic scattering for the following cases.
-
•
Case 1: all cross sections within the fuel material (i.e. UZrH1.6), including the thermal cross section of hydrogen in zirconium hydride (h/zr) and thermal cross section of zirconium in zirconium hydride (zr/h) are adjusted to specific temperature (294 K, 400 K, 500 K, 600 K, 700 K and 800 K). Calculation at 294 K is considered as a reference case.
-
•
Case 2: the Doppler effect was studied, by simply adjusting all cross sections to a specific temperature (294 K, 400 K, 500 K, 600 K, 700 K and 800 K), except the cross section of 238U, which was considered constant at 294 K.
-
•
Case 3: the effect of temperature increase in h/zr was evaluated, by adjusting all cross sections to a specific temperature (294 K, 400 K, 500 K, 600 K, 700 K and 800 K), except the thermal cross section of hydrogen in zirconium hydride (h/zr), which was considered constant at 296 K.
In all three cases the reaction rates using ‘detector’ function were calculated using Serpent code. User defined total reaction rates (RRi) (inflicted by neutrons with energy E) in volume V is obtained by integration:(4.1)where Σi is the macroscopic cross section for reaction i and describes the interaction probability per path length travelled by the neutron and it is given in units 1/cm and Φ is the scalar flux which is equivalent to the total path length travelled by all neutrons within volume V in time t and it is given in units 1/(cm2s).
The following material (fuel) total reaction rates were calculated: total fission (MT -6), total capture (MT -2) and total elastic (MT -3). It should be noted that within the Serpent code the negative entries define total reaction rates related to material, while the positive response functions are related to nuclide reaction rates, and they correspond to the reaction MT numbers used in ENDF format data [31]. All reaction rates were calculated using the default source rate normalization (TOT_LOSSRATE = CAPTURES + FISSIONS + LEAK = 1), where loss includes all reactions in which the incident neutrons is lost, i.e. all capture ractions, fissions and neutrons that leak from the system. Two energy groups, thermal energy group no.1 (E < 4 eV) and epithermal energy group no. 2 (4 eV < E < 9.2 keV) were used. The thermal and epithermal energy group boundaries are based on original WIMS-D structure [33].
Only the differences in reaction rates from the reference case (case 1 at T = 294 K) are presented in Table 3 to Table 5. Reaction rate differences (ΔRRi) are calculated using the following equation:(4.2)where i is the reaction rate type: fission, capture or total elastic scattering and RRi (reference) is the reaction rate value for the reference case i.e. case 1. RRi is a reaction rate value for a given case (Case 2 - Table 4 or Case 3 - Table 5 results). In addition, the discrepancies (Δ RR) with regards to the value at the reference state (T = 294 K) are presented for these three cases in Fig. 7, Fig. 8 and. The results of the differences in reaction rates for each nuclide are presented in Appendix 1 for case 1.
Table 3. Case 1 where the temperature increase was considered in all isotopes within the fuel material. Results are given for two energy groups (gr.) and for different temperatures (T). Differences (Δ RR) are given in [%] with regards to the value at the reference state (T = 294 K).
| T [K] |
group no. |
fission (MT -6) Δ RR [%] |
capture (MT -2) Δ RR [%] |
elastic (MT -3) Δ RR [%] |
|---|---|---|---|---|
| 294 | 1 | 0.00 | 0.00 | 0.00 |
| 400 | 1 | −0.78 | −0.42 | 0.88 |
| 500 | 1 | −1.70 | −0.82 | 2.42 |
| 600 | 1 | −2.68 | −1.21 | 4.42 |
| 700 | 1 | −3.70 | −1.60 | 6.57 |
| 800 | 1 | −4.65 | −1.95 | 8.88 |
| 294 | 2 | 0.00 | 0.00 | 0.00 |
| 400 | 2 | 0.05 | 3.21 | 0.00 |
| 500 | 2 | 0.11 | 5.92 | 0.07 |
| 600 | 2 | 0.20 | 8.38 | 0.14 |
| 700 | 2 | 0.34 | 10.51 | 0.27 |
| 800 | 2 | 0.40 | 12.49 | 0.34 |
Table 4. Case 2 where the temperature increase was considered in all isotopes within the fuel material, except for238U, which was left constant at 294 K. Results are given for two energy groups (gr.) and for different temperatures (T). Differences (Δ RR) are given in [%] with regards to the value at the reference state (T = 294 K).
| T [K] | group. No |
fission (MT -6) Δ RR [%] |
capture (MT -2) Δ RR [%] |
elastic (MT -3) Δ RR [%] |
|---|---|---|---|---|
| 294 | 1 | 0.00 | 0.00 | 0.00 |
| 400 | 1 | −0.52 | −0.16 | 1.15 |
| 500 | 1 | −1.26 | −0.38 | 2.89 |
| 600 | 1 | −2.07 | −0.59 | 5.09 |
| 700 | 1 | −2.93 | −0.82 | 7.44 |
| 800 | 1 | −3.77 | −1.05 | 9.90 |
| 294 | 2 | 0.00 | 0.00 | 0.00 |
| 400 | 2 | 0.28 | 0.32 | 0.38 |
| 500 | 2 | 0.46 | 0.64 | 0.48 |
| 600 | 2 | 0.72 | 0.97 | 0.64 |
| 700 | 2 | 0.97 | 1.20 | 0.82 |
| 800 | 2 | 1.19 | 1.46 | 0.95 |
Table 5. Case 3 where the temperature increase was considered in all isotopes within the fuel material, except for thermal scattering cross section h/zr, which was left constant at 294 K. Results are given for two energy groups (gr.) and for different temperatures (T). Differences (Δ RR) are given in [%] with regards to the value at the reference state (T = 294 K).
| T [K] | gr. |
fission (MT -6) Δ RR [%] |
capture (MT -2) Δ RR [%] |
elastic (MT -3) Δ RR [%] |
|---|---|---|---|---|
| 294 | 1 | 0.00 | 0.00 | 0.00 |
| 400 | 1 | −0.30 | −0.27 | −0.27 |
| 500 | 1 | −0.57 | −0.51 | −0.50 |
| 600 | 1 | −0.75 | −0.69 | −0.66 |
| 700 | 1 | −0.95 | −0.88 | −0.83 |
| 800 | 1 | −1.13 | −1.04 | −0.99 |
| 294 | 2 | 0.00 | 0.00 | 0.00 |
| 400 | 2 | 0.01 | 3.18 | 0.23 |
| 500 | 2 | −0.03 | 5.76 | 0.17 |
| 600 | 2 | −0.07 | 8.07 | 0.14 |
| 700 | 2 | −0.08 | 10.06 | 0.12 |
| 800 | 2 | −0.09 | 11.91 | 0.08 |
The fraction of total moderation in TRIGA fuel versus water was analysed by comparing the calculated total elastic scattering (MT 2) reaction rates for fuel and surrounding water using the MCNP (MCNP 6.20) code [34]. It was calculated that around 40 % of the total neutron moderation occurs in TRIGA fuel and the rest in surrounding water and that the change of this ratio with increasing water and fuel temperature is negligible. Further details of moderation ratio analysis is presented in chapter 4.2.
It can be seen in Table 3 that an increase of fuel temperatures from T = 294 K to T = 800 K using temperature steps of 100 K, where the cross section temperature adjustment is considered in all nuclides for each temperature step, leads to a decrease of fission reaction rate in fuel by 4.65 % in the thermal energy group (E < 4 eV), which is mainly due to fission reaction rate decrease of 235U (Table 15 in Appendix 1). In addition, the total capture reaction rate (Table 3) increases by 12.49 %, as a consequence of the capture increase in 238U (Table 16 in Appendix 1) in the epithermal energy range (4 eV < E < 9 keV) and due to the capture rate increase in Zr nuclides (Tables Table 18, Table 19, Table 20, Table 21, Table 22 in Appendix 1). It can also be seen that the total scattering reaction rates increases by 8.88 % in the thermal energy group.
Next, the comparison of the total reaction rate results between Table 3, Table 4is considered. Table 4 represent the results from case 2, where the fuel temperatures increase from T = 294 K to T = 800 K and the cross section temperature adjustment is applied to all nuclides within the fuel material, except for the 238U. The main difference is in the capture reaction rates in the epithermal energy group. It can be seen in Table 4 that at 800 K the total capture reaction rates difference is 1.46 %, while in Table 3 the difference is 12.49 % for the epithermal energy group. Since the Monte Carlo method treats the self-shielding effects from lattice configuration explicitly, this effect is clearly visible in capture reaction rates in epithermal energy group where the resonances from 238U are strongest, and since the cross sections adjustment was not considered in case 2 (Table 4), the results show the highest deviation.
Finally the comparison of reaction rates results between Table 5, Table 3 is considered. Table 5 shows the results for case 3, where the temperature cross sections are adjusted for the change in temperatures from T = 294 K to T = 800 K, for all nuclides within the fuel material, except for the thermal scattering cross section of hydrogen in zirconium hydride (h/zr). It can be seen in Table 5 that at 800 K the total scattering reaction rate difference is −0.99 %, while in Table 3 the difference is 8.88 % for the thermal energy group.
Next, the analysis of thermal scattering cross sections was considered. In our calculations, two thermal cross sections were used in the fuel material: thermal scattering cross section of hydrogen in zirconium hydride (h/zr) and zirconium in zirconium hydride (zr/h). Thermal scattering effect was analysed with the Serpent 2 code using two reaction rates: S(α,β) elastic scattering (MT 1002) and S(α,β) inelastic scattering (MT 1004). These reactions are not official ENDF reaction type numbers but are considered as neutron reactions in the Serpent code. Results have shown that the predominant effect is the inelastic scattering (MT 1004) since with the temperature increase from T = 294 K to T = 800 K the inelastic scattering increases by around 150 % for h/zr and 98 % for zr/h (Table 23 and Table 24 in Appendix 1).
In general, the increase of fuel temperature increases the up-scattering probability in the thermal range of the neutron flux energy spectrum, causing its deformation and hardening, as can also be seen in Fig. 10. In Fig. 10 three lethargy neutron spectra are given for neutrons with thermal energies. First, we can observe the effect of spectrum hardening for the reference case where the temperature was increased from 294 K to 700 K (the effect is shown with magenta (294 K) and red (700 K) lines). To validate that this effect is caused by the thermal scattering cross-section of hydrogen in zirconium hydride (h/zr) an additional neutron spectrum at 700 K was calculated for case 3, where all cross-sections are adjusted to a temperature of 700 K, except the thermal cross-section of hydrogen in zirconium hydride (h/zr). This spectrum is marked as a green line in Fig. 10. It can be seen that the spectrum remains the same as it is the neutron spectrum for the reference case at 294 K (magenta line) since the temperature adjustment of h/zr was not considered. Therefore we could conclude that spectrum hardening is caused by the increasing temperature in thermal scattering cross-sections of H in ZrH, as can be seen from the red line in Fig. 10. Additional, the ratio η = υσf/σa is presented for case 1 for fuel temperature at 700 K.
As demonstrated, Doppler broadening and spectrum hardening influence the reaction rates. To evaluate the contribution of both effects, the temperature reactivity coefficients of fuel are calculated for cases 2 and 3 (Table 6 and Table 7).
Table 6. Calculated k∞ using ENDF/B-VII.0 library, corresponding reactivity (ρ=(k∞-1)/k∞) and calculated temperature reactivity coefficient of fuel in dependence of temperature (T) for case 2, where the effect of238U was evaluated. Additional the uncertainties listed in the table are the statistical errors of the multiplication factor calculations δk∞ and corresponding reactivity δρ. Also the deviation (α/α(ref)) from the reference case are given.
| T [K] | k∞ ± δ k∞ | ρ ± δ ρ | α ± δ α [pcm/K] | α/α(ref) [%] |
|---|---|---|---|---|
| 294 | 1.01096 ± 0.00010 | 0.01084 ± 0.00020 | ||
| 400 | 1.00616 ± 0.00010 | 0.00612 ± 0.00020 | −4.45 ± 0.38 | 68.03 |
| 500 | 0.99919 ± 0.00010 | −0.00081 ± 0.00020 | −6.94 ± 0.40 | 75.52 |
| 600 | 0.99131 ± 0.00010 | −0.00877 ± 0.00020 | −7.95 ± 0.40 | 81.87 |
| 700 | 0.98318 ± 0.00010 | −0.01710 ± 0.00020 | −8.34 ± 0.40 | 86.13 |
| 800 | 0.97525 ± 0.00010 | −0.02538 ± 0.00020 | −8.27 ± 0.40 | 84.32 |
Table 7. Calculated k∞ using ENDF/B-VII.0 library, corresponding reactivity (ρ=(k∞-1)/k∞) and calculated temperature reactivity coefficient of fuel in dependence of temperature (T) for case 3, where the effect of h/zr was evaluated. Additional uncertainties listed in the table are the statistical errors of the multiplication factor calculations δk∞ and corresponding reactivity δρ. Also, the deviation (α/α(ref)) from the reference case are given.
| T [K] | k∞ ± δ k∞ | ρ ± δ ρ | α ± δ α [pcm/K] | α/α(ref) [%] |
|---|---|---|---|---|
| 294 | 1.01106 ± 0.00010 | 0.01094 ± 0.00020 | ||
| 400 | 1.00831 ± 0.00010 | 0.00824 ± 0.00020 | −2.54 ± 0.38 | 38.89 |
| 500 | 1.00593 ± 0.00010 | 0.00590 ± 0.00020 | −2.35 ± 0.40 | 25.54 |
| 600 | 1.00422 ± 0.00010 | 0.00420 ± 0.00020 | −1.69 ± 0.40 | 17.43 |
| 700 | 1.00238 ± 0.00010 | 0.00237 ± 0.00020 | −1.83 ± 0.40 | 18.88 |
| 800 | 1.00083 ± 0.00010 | 0.00083 ± 0.00020 | −1.55 ± 0.40 | 15.75 |
In the last column of Table 6, Table 7, the temperature reactivity coefficients of fuel for cases 2 and 3 relative to the reference α are presented. One can conclude that for the case where the cross-sections temperature adjustment for 238U (case 2) is not considered, i.e. the contribution of the Doppler effect is evaluated, the α for case 2 is close to the reference α. In this case the α of the Doppler effect is on average around 15 %–30 % in the temperature range between 294 K and 800 K while the rest is contributed by the spectrum hardening which is affected by specific resonance structure of thermal scattering cross-section of hydrogen in Zr lattice. The results are also presented in Fig. 11. Here we demonstrate that in TRIGA fuel spectrum hardening is the major feedback mechanism contributing to the prompt negative temperature reactivity coefficient.
 Fig. 11. Temperature reactivity coefficient of fuel for standard fuel as a function of temperature for cases 1, 2 and 3. Corresponding error bars represent 1 sigma statistical uncertainty from Monte Carlo. calculations.
Additional Serpent calculations using the same benchmark core 133 that was presented in chapter 3.1 have shown that the value of the fuel temperature coefficient increases with burnup, suggesting that α depends on uranium 235U. Results for the reference case (case 1) and different burnups are presented in Fig. 12. We have considered two burnup cases (burnup = 15 % and burnup = 30 %), where the uranium content (235U) is reduced by 15 % and 30 %, respectively, relative to the uranium content in the fresh fuel. In addition, data of temperature reactivity coefficient of fuel as a function of temperature from reactor TRIGA safety analysis report (labeled BURNUP = 0 (SAR TRIGA)) [25] are presented on Fig. 12, as they are used in calculations in section 0.
 Fig. 12. Temperature reactivity coefficient of fuel for standard fuel as a function of temperature and burnup corresponding error bars represent 1 sigma statistical uncertainty from Monte Carlo calculations.
4.2. Fraction of neutron moderation in TRIGA fuel (UZrH1.6) and surrounding water (H2O)
In the TRIGA Mark II research reactor, the neutron moderation occurs by elastic scattering on 1H in two different materials: the TRIGA fuel (UZrH mixture) and the surrounding water. We were interested in the fraction of total moderation that occurs in the fuel elements, since it becomes important in pulse experiments due to higher fuel temperatures. The fraction of total moderation in UZrH fuel is defined as(4.3)where RR represents the reaction rates tallied in the fuel and surrounding water. The determination of the tallied volume is important for the normalization of the tallied results. We have decided to analyse only the part of reactor core that corresponds to the active height of the fuel element and the radius to the graphite reflector . The MCNP model of the JSI TRIGA reactor with depicted surrounding water and fuel elements with its active height is presented in Fig. 13. The calculated volumes are
 Fig. 13. Schematic of the JSI TRIGA's MCNP model with the depicted surrounding water and fuel elements with its active fuel height. The depicted regions were used to tally for neutron moderation contributions.
The fraction of total moderation in TRIGA fuel was determined using different tallies. We tallied total number of elastic scatterings (MT 2) in the whole material (all fuel (UZrH1.6) and H2O in the core) and only on 1H in that material. The reaction rate density (normalized to tallied volume) is calculated as Eq. (4.4). The results are presented in Table 8. The 1σ of statistical uncertainty for all tallied reaction rates is below 1 %.(4.4)
Table 8. Macroscopic reaction rates for elastic scattering in TRIGA fuel and surrounding water. Two cases where whole material and only 1H was analysed. The depicted reaction rates are normalized on the tallied volume and per source particle, meaning reaction rate density is presented.
| Tallied whole material | Only scattering on 1H | |
|---|---|---|
| 6.86E-04 | 5.45E-04 | |
| 8.89E-04 | 8.31E-04 | |
| 43.56 % | 39.61 % |
In addition, we determined the fraction by analysing the difference in macroscopic cross section of fuel (UZrH) and water (H2O). The macroscopic cross section is defined as , where n represents number density of material. The differences between fuel and water are in number density and the thermal scattering cross-section of 1H bound in them. The average thermal scattering cross section at lower energies for 1H bound in H2O is 25 b, while the same cross section for 1H bound in ZrH is 15 b. The fraction can be therefore written asIn order to further understand the moderation procedure in TRIGA reactor, individual moderation before the fission process was analysed. Previously, all occurring moderations (elastic scattering on hydrogen) were tallied, not taking into account that not all scatterings result in equal energy loss or probability of fission occurring afterwards. Consequently different approach was taken, where scatterings that occur right before the fission process were analysed by determining the material (fuel, water) on which the scattering occur. The scattering ratio for individual scatterings before the occurrence of fission was determined using the PTRAC option in the MCNP Monte Carlo neutron transport code, where all neutron events are recorded, and the results are presented in Fig. 14. The analysis was done by going back in time from fission and looking at elastic scatterings on hydrogen from 1st before fission to the 15th one. The analysis was done by using nuclear data at 293 K.
 Fig. 14. Ratio of elastic scatterings (MT2 ENDF's reaction type) in water (H2O) and TRIGA's fuel (UZrH) as a function of number of scatterings before the occurrence of fission (#1 representing the last scattering before fission, and #5 fifth scattering before fission). The 1 sigma statistical uncertainty for all values is below 3 % and is presented with error bars.
It can be observed that in around 80 % of cases right before inducing fission a neutron is scattered on hydrogen in the fuel (ZrH). The probability for the neutron to be scattered in the fuel is above 60 % for the five scatterings before fission and converges to the expected 50 % by the 15th scattering, as its correlation to the fission process approaches zero. Conclusion can be made that the change in scattering probability on hydrogen in fuel (ZrH) due to temperature change has direct consequences on the fission process, which indicates the importance of thermal scattering nuclear data and its dependence on temperature.
The calculations performed so far were using cross section libraries at room temperature of 293 K. To analyse the effect of operational fuel and water temperatures on the neutron moderation fraction of the fuel the analysis was repeated with different combinations of water temperature Tw and fuel temperature Tf. The results are presented in Table 9.
Table 9. Macroscopic reaction rates for elastic scattering in TRIGA fuel and surrounding water and the moderation fraction xfuel for different combinations of water and fuel temperatures.
| Elastic scattering tallied in the whole material | Tw = 293 K Tf = 293 K | Tw = 350 K Tf = 350 K | Tw = 350 K Tf = 500 K | Tw = 350 K Tf = 700 K |
|---|---|---|---|---|
| 6.86E-04 | 6.95E-04 | 7.00E-04 | 7.14E-04 | |
| 8.89E-04 | 8.68E-04 | 8.77E-04 | 8.97E-04 | |
| 43.56 % | 44.47 % | 44.39 % | 44.32 % |
The temperature dependence was also determined for moderation ratio of individual scatterings before the occurrence of fission, which is presented in Fig. 14. We repeated the complete analysis at higher fuel temperatures of 600 K and 900 K. General nuclear data as well as thermal elastic scattering data were taken at the mentioned temperature. The observed change was within 2 sigma of statistical uncertainty meaning that the moderation ratio for individual scatterings practicaly does not change with temperature. The results are presented in Fig. 15.
 Fig. 15. Absolute changes of the ratio of elastic scatterings (MT2 ENDF's reaction type) in water (H2O) and TRIGA's fuel (UZrH) due to fuel temperature as a function of number of scatterings before the occurrence of fission. Number of scatterings before fission is the same parameter as in Fig. 14.
From this a conclusion can be made that the fraction of neutron moderation in TRIGA fuel (UZrH) of the whole moderation in TRIGA reactors is less than 45 % and does not change with increasing temperature and the same conclusion can be made for the analysis of individual moderation ratio's before the occurrence of fission.
4.3. Effect of fuel and cladding temperature expansion during the pulse experiment on the effective multiplication factor
In this chapter the influence of temperature expansion/contraction of fuel and stainless steel (SS) cladding during the pulse experiment on the effective multiplication factor of the TRIGA Mark II research reactor at JSI is analysed.
The TRIGA benchmark model with core number 190 [4,35] is taken as the reference MCNP model. In the model the fuel elements and control rods with fuel extensions were modified. Fuel and SS cladding volume were changed on the basis of expansion/contraction due to temperature change, while the density was changed accordingly so that the mass remained constant. Dimensions changed due to the temperature are calculated as:(4.5)where presents the changed dimension, is the initial dimension, is the linear temperature expansion coefficient and presents the temperature change. The linear temperature expansion coefficient of fuel and SS cladding [36] are:(4.6)(4.7)When the volumes in the model are changed gaps are formed or changed in certain places in the fuel elements, which are filled with air. These gaps occur between the zirconium rod and the fuel and above the zirconium rod. In addition, the volume of air between the fuel and SS cladding changes, the graphite disk moves higher, the outer diameter of the fuel increases and also the height of the fuel increases at the expense of the expansion of the SS cladding. Similar effects occur both in the fuel element and in the fuel extension of the control rods. Changes in the fuel element at room temperature and at 600 K can be seen in Fig. 16.
 Fig. 16. Fuel element at room temperature 293 K on left and at 600 K at right. All dimensions are in cm.
In order to analyse impact of different contributions three cases are distinguished.
-
-
Fuel and SS cladding volumes are changed in all fuel elements and control rods with fuel follower (case labeled as total).
-
-
Fuel volume is changed in all fuel elements and control rods with fuel follower (case labeled as fuel material).
-
-
SS cladding volume is changed in all fuel elements and control rods with fuel follower (case labeled as SS cladding).
The results of the difference of effective multiplication factor at certain temperature and effective multiplication factor at 300 K as a function of temperature, where the temperature affects the fuel and SS cladding expansion/contraction are shown on Fig. 17.