1. Introduction
The transport network has had a significant impact on the spread of infectious diseases (such as influenza A/H1N1, SARS, and Ebola) over through the years [50,53]. The novel contagious coronavirus, also known as COVID-19, has recently spread rapidly around the globe, the World Health Organization (WHO) declared a pandemic in March 2020, following the discovery of the first verified case in the Chinese city of Wuhan in December 2019 [27,47]. As of September 29, 2021, the epidemic had spread to 223 countries and infected more than 233,569,801 people worldwide, resulting in more than 4779,109 deaths [45]. To prevent the spread of the COVID-19, most countries imposed strict restrictions and laws, including lockdowns, traffic limitations, employment, educational institutions, shopping, all religious services and, prohibitions on all social gatherings [3]. Several governments implemented these restrictions gradually, while others did so abruptly, resulting in partial or total lockdown [9]. At the very same time, road crashes continue to be one of the most serious transportation issues worldwide, leading in property damages, financial losses, and personal deaths and injuries [17,35]. Around 1.35 million people are dead on roads each year around the globe and, it is also the eighth major reason of deaths, with up to 50 million people injured each year [46]. The worldwide and local mobility restrictions imposed in response to the rapidly spreading COVID19 pandemic have resulted in significant changes in people's travel behavior also [28]. However, Transport demand and travel behavior are, in reality, heavily linked to societal interaction. Because of this pandemic, travel and work two of the most basic aspects of daily life, have changed dramatically.
Because of the decreased traffic volume, road traffic accidents have dropped in most countries around the world. The reduction in traffic volume is thought to have contributed to an increase in speeding drivers. Lower traffic volume and congestion, especially during the start of the epidemic, combined with a decline in law enforcement created an environment where speeding was more likely [30,37,44]. Initial statistics indicates that, in addition to speeding, intoxicated driving is on the rise [49]. All public safety precautions implemented to counteract COVID-19 led to a reduction in traffic users (especially at peak weekday travel periods) also indicated an increase in unsafe road user activity, including speeding and driving while intoxicated. Moreover, initial road accident statistics indicate a reduction in both fatalities and non-fatal road traffic crashes, when others demonstrate a drop in total accidents but an increase in more fatal accidents [16,48]. Driver and pedestrian accident and mortality rates in the age group (80 years and older) would have been reduced during in the epidemic than it was before because a large percentage of the elderly would follow physical distancing suggestions. They would also have a lower proportion of driving and pedestrian injuries and deaths than younger individuals [31].
The effects of external COVID-19 isolation strategies on how movement attributes evolved after COVID-19 expanded has not been extensively researched. It might be stated that the introduction of social distancing policies had a substantial impact on individual travel both at local and global travel, based on initial study and data from various nations [29]. Travel demand has decreased in overall, and vehicular traffic and public transportation use have decreased dramatically throughout many countries in the world. People stayed away from public transportation because it was thought to be a breeding place for viruses and a location where it would be hard to prevent interaction with other travelers [40]. Bicycle riding increased at the outbreak of the epidemic as people are seeking a secure, dependable mode of transportation, and it has been a common mode of transportation, particularly for small or recreational excursions, ever since. The COVID-19 epidemic also has had a major impact on airline travel patterns. The number of flights as well as the number of passengers has considerably decreased [54]. The current study aims to provide an overview of the impact of the COVID-19 pandemic on road traffic crashes, deaths, and injuries, as well as road travel behavior, based on multiple researches.
The following is how the rest of the paper is structured. Section 2 describes the method of selecting papers from a wide pool of previously published studies. For deeper understanding, the "Taxonomy of the Reviewed Systems" section classifies the several studies examined. The section on "Literature on Developed Systems" describes and summarizes the various papers that were studied during COVID-19. Section 5 depicts the "Open discussion and future challenges." Finally, "Conclusions" brings the article to a close.
2. Selection of papers
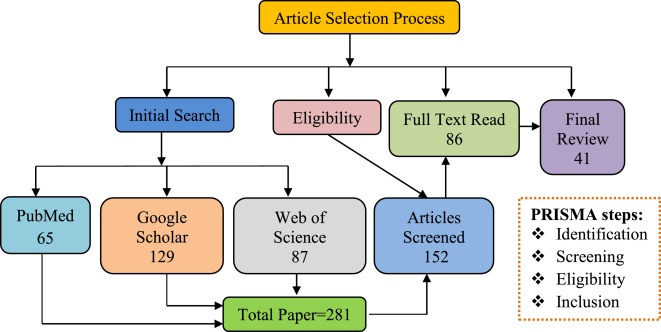
Only the most current papers published in this field in the last two years (2020 and 2021) are considered in this assessment. PRISMA (Preferred Reporting Items for Systematic Reviews and Meta-Analyses) was used to perform the literature review for this study, as depicted in Fig. 1. Firstly, in the identification step, the study was limited to three databases: Google Scholar, PubMed, and Web of Science with the term of impact of COVID-19 on 'road traffic safety' and 'travel behavior' separately. Here, 281 articles were identified. Next, in the screening and eligibility step, after thoroughly reviewing each selected paper, certain areas of interest were discovered and assessed. Due to unrelated study objectives, some papers were eliminated from the review throughout the quality evaluation procedure by screened one by one article title and abstract carefully. Here, 129 papers with inappropriate research objectives were detected, and 86 articles were chosen for full text reading. Finally, the most relevant articles with the studying issue were included in this review, which was evaluated and summarized. To carry out this evaluation, 41 papers were selected by a sequential procedure of identification, screening, and eligibility testing. There were 18 research articles that looked at the impact of COVID-19 on road traffic safety and 23 scientific papers that looked into travel behavior changes among them.
 Fig. 1. Flowchart of PRISMA-based article search strategy.
3. Taxonomy of the reviewed systems
The effects of COVID-19 pandemic on travel patterns, congested roads, and road travel safety are generating a lot of discussions. Road traffic accidents are still one of the world's top critical traffic problems, resulting in property damage, economic difficulties, and people deaths and injuries. In reaction to the fast spreading COVID19 epidemic, global and regional movement limitations have resulted in substantial changes in people's travel behavior.
3.1. Road traffic safety
Fig. 2, Fig. 3 show taxonomy of different studies used in this study to analyze the impact of COVID-19 on road traffic safety and travel behavior. We investigated a total of 18 research papers for this study, all of which looked at the impact of COVID-19 on road traffic safety. For the purpose of assessing the influence of the COVID-19 pandemic on road safety, 9 publications (50% of total evaluated articles) employed statistical analysis, while 9 papers (50% of total reviewed articles) used questionnaire surveys, machine learning, time series analysis, and other methods. Statistical analysis includes poisson regression, negative binomial model, logistic regression, and chi square test, etc.
 Fig. 2. Taxonomy of the previously studied article for analyze the impact of COVID-19 on road traffic safety.
 Fig. 3. Taxonomy of previous study on travel behavior change during COVID-19.
3.2. Travel behavior
COVID-19 pandemic results in extreme changes in travel behavior in roadway. To investigate this travel behavior change, we looked at a total of 23 scientific papers and a taxonomy have been presented in Fig. 2. Depending on the methodology, these 23 articles can be exposed in three categories such as (i) statistical analysis; (ii) descriptive analysis; (iii) Both statistical & descriptive analysis. Among these, 13 papers (56.5% of total reviewed articles) are on statistical analysis, 6 papers (26.1% of total reviewed articles) are on descriptive analysis and 4 papers (17.4% of total reviewed articles) are on both statistical and descriptive analysis on travel behavior during COVID-19 epidemic. Statistical analysis includes paired t-test, chi square test, negative binomial model, two binary logit models, least‐squares regression models, Mann Whitney U test; Wilcoxon signed‐rank test, Gini index; Inclusive Development Index; Human Development etc. From the analysis of travel behavior, one of the most important observations is that people have inclined in private transport from public transport in large.
4. Literature on developed systems
In terms of traffic safety and travel behavior, recent literature studies have provided important insights and information to govern how future lockdowns are managed. This research reviews a number of articles, examining the causes of crashes, data sources, methodology, and important findings. Sections 4.2 and 4.3 go through the important findings of the previous studies, which are summarized in Tables 1 and 2, as well as taxonomy.
Table 1. Summary of previous researches that analyzes the impact of COVID-19 on road traffic safety.
| Author | Study Area | Accident Increase/Decrease | Causes of crashes | Method | Data Collection Sources |
|---|---|---|---|---|---|
| Yao et al. [51] | USA | Angle crashes have increased significantly | Driver behavior has shifted in a negative way, with more carelessness and speed | Statistical analysis | Michigan State Police (MSP) Traffic Crash Reporting System (TCRS) |
| Sekadakis et al. [35] | Greece | The total number of traffic collisions fell, the number of fatalities and minor injuries increased dramatically | The volume of traffic has dropped dramatically | Seasonal Autoregressive Integrated Moving Average (SARIMA) | Hellenic Statistical Authority (HSA) |
| Muley et al. [22] | Qatar | Fewer fatalities | Lockdown in every way | Measuring the cumulative effect of small changes | Public Works Authority (ASHGHAL) |
| Saladié et al. [33] | Spain | The number of road accidents is increasing | Unwillingness to use public transit, more private vehicles are being driven | Chi-square test | Directorate-General of Fire Prevention, Extinction and Rescue (DGPEIS) |
| Vanlaar et al. [48] | USA, Canada | Increase high-risk driver behavior | Most of the people said their behavior had not changed | Logistic regression | Traffic Injury Research Foundation (TIRF), Road Safety Monitor (RSM) surveys |
| Lin et al. [19] | USA | Non-fatal accident decreased but severe and fatal cases of traffic accidents remains the same | Traffic lockdown | Difference-in-differences (DID) regression analyses | Los Angeles and New York City |
| Barnes et al. [5] | USA | Decrease in traffic accidents | Stay-at-home | Regression discontinuity design | COVID Tracking Project, Google Community Mobility reports |
| Michelaraki et al. [21] | Greece, Saudi Arabia, Cyprus and Brazil | Road crashes decreased | Traffic lockdown | Fusion technology, machine learning algorithms and driver monitoring metrics | GPS, accelerometer data, and gyroscope data |
| Sedain and Pant [34] | Nepal | Reduced the amount of traffic collisions, injuries and deaths that result from them | Lockdown, Speeding | Excel spreadsheet analysis | Media reports |
| Gupta et al. [10] | India | Reduced crash fatality | Lockdown | Linear mixed model | Traffic police website or national road crash database |
| Huang et al. [12] | China | Electric bicycle related RTIs increased, total number of RTIs decreased | Lockdown | Retrospective study | Suzhou pre-hospital emergency center |
| Yan and Zhu [52] | China | E-bike fatal accidents are down | Lockdown | Multi-output regression models | Province-level and monthly socioeconomic data |
| Zhang et al. [54] | USA | Number of people involved in accident reduced | Lockdown | Negative Binomial (NB) | National Household Travel Survey and American Community Survey |
| Qureshi et al. [30] | USA | Reduction in road traffic accidents | Mandated societal lockdown | Time series analysis | Statewide Traffic Accident Records System |
| Rapoport et al. [31] | Canada | Deaths and injuries among older drivers have decreased | Traffic lockdown | Agresti-Coull method | Ontario Ministry of Transportation's (MTO) Research and Evaluation Office |
| Alhajyaseen et al. [3] | Qatar | Total number of crashes reduced, serious and fatal injuries increased | Traffic lockdown | Questionnaire surveys | Questionnaire surveys |
| Oguzoglu [24] | Turkey | Decline in accidents | Traffic lockdown | Poisson models | Ministry of Transport and Infrastructure (MTI), monthly city-level traffic accident reports |
| Shaik et al. [37] | Bangladesh | Reduces deaths and injuries but continuing | Traffic lockdown | General overview | Newspaper articles, WHO, Worldometer |
Table 2. Summary of previous researches that analyzes the impact of COVID-19 on travel behavior.
| Author | Data Sources | Methodology | Key findings | Study Region |
|---|---|---|---|---|
| Parr et al. [26] | Florida Department of Transportation (FDOT) | Paired t-test, SPSS | Overall traffic volume of statewide dropped by 47.5 percent; impact of COVID-19 on freeway traffic appears to start earlier than on arterial roads; Changes in travel behavior were influenced by spring break and decisions made by local governments and employers | Florida, USA |
| Parker et al. [25] | Traffic survey by smartphone | Mobility data analysis | The pandemic impacted the travel patterns of transit riders more than the travel patterns of nonriders; Due to transit service changes, infection risk on transit, trip reduction, 75% transit riders reported taking transit less | USA |
| Wang et al. [43] | Regional Household Travel Survey (RHTS); Citywide Mobility Survey (CMS); General Transit Feed Specification (GTFS); Open Street Map (OSM); Metropolitan Transportation Authority (MTA) | Develop pre-COVID Model & COVID Model by using MATSim-NYC | Number of cars increases to 142%; Transit ridership would decrease 50% due to limiting transit capacity; The trips by transit, walking and driving have decreased to 88%, 54%, 76%, respectively; The total number of trips also drastically reduced | New York, USA |
| Abdullah et al. [2] | Online Questionnaire Survey | Multinomial logistic regression | Shifted from public transport to private transport and non‐motorized modes; Majority of trips were conducted for shopping; Factor affecting mode choice such as gender, employment, car ownership, primary traveling purpose | Worldwide |
| Truong and Truong [41] | Bureau of Transportation Statistics (BTS); Centers for Disease Control and Prevention (CDC) | Time‐series models using Autoregressive Moving Average (ARIMA) method | Shows a closed loop scenario between residents` travel behavior and COVID-19 infections | USA |
| Hara and Yamaguchi [11] | Mobile spatial statistics (MSS) | Statistical analysis | Significantly reduced in trips and inter‐ prefectural travel; Reduced trips 45% in Tokyo and 27% in Osaka; The number of individuals traveling from large cities to local cities has decreased dramatically | Japan |
| Anwari et al. [4] | Questionnaire Survey | Contingency tables; Ordinal logistic regression | In urban areas online work or education (950%) and shopping (170%) has risen; During the epidemic, buses are still the most popular mode of transportation for short-distance recreation (26.75%), markets (43.18%), and long-distance recreation (35.66%); Males continue to work and shop outside, putting them at more danger of COVID-19 infection than females | Bangladesh |
| Chua et al. [7] | Web-based survey | Confirmatory factor analysis (CFA); SPSS and AMOS 24 | Global health issue has opened up new possibilities to be more resilient and agile for the tourism and travel industry by reconsidering and remaking the operational practices | USA |
| Abdullah et al. [1] | Questionnaire survey | McNemar-Bowker test; Mann-Whitney U test; Exploratory factor analysis (EFA) | Significant shift in primary travel from work and studies to shopping; Non-commuting travels were also notably different; Shift travel from motorbike to non-motorized modes for distances less than 5 km, People shifted from public transport to private car for long distances | Pakistan |
| Wachyuni and Kusumaningrum [42] | Online questionnaires survey | Descriptive study using quantitative approach | Majority (78%) of respondents would go back on tour; 65% will return to travel within 6 months; Travel intention is higher than travel anxiety | Jakarta, Indonesia |
| Menon and Keita [23] | Web-based survey by University of South Florida (USF) | Descriptive data analysis | The number of people using public transportation and hailing a cab has plummeted; Bike sharing operations have increased; The number of people using bike-sharing services has grown | USA |
| Huang et al. [13] | Baidu Maps | Data-driven analysis | Public transit declines to 45%; Proportions of taking a private vehicle and riding on a bicycle significantly increased; Proportion of visiting residential areas greatly increases to 31.25% and the proportion of visiting transport facilities rapidly declines to 19.00% | China |
| Zudhy et al. [56] | Web-based questionnaire survey | Structural Equation Model (SEM) | Teleworking and e-learning directly affected activity-travel behavior changes; Significant decline in the volume of cars, motorbikes, and other types of transportation; Nearly 80% higher than normal use of ICT tools | Indonesia |
| Shakibaei et al. [38] | Paper-based panel survey | Panel data and descriptive analysis, Chi-square test | The shift in travel activity patterns and mobility appears to be quite extreme; Teleworking and distance education is encouraging particularly for commuting and Social/Recreational/Leisure (SRL) trips | Istanbul, Turkey |
| Shamshiripour et al. [39] | Travel behavior survey; Questionnaire survey | Descriptive and statistical analysis | Commuting to workplace and in-store shopping are being switched by telecommuting and online shopping, around 43% is expected to travel with airplanes less frequently in the future; 37% of the respondents had not worked from home even for a single day during the pandemic; 39% had first time online grocery shopping experience | Chicago, USA |
| Jiao et al. [15] | Household Pulse Survey (HPS) by U.S. Census Bureau | Two binary logit models using STATA software | The effects of age, gender, marital status, and work type on both measures of travel behavior are distinct; Identifies the factors affecting the choice of taking trips by public transportation | USA |
| Brough et al. [6] | King County Metro; Safe Graph; Automated passenger counter (APC) | Least squares regression | Travel intensity decreased less among those who were less educated and had a lower income | King County, Washington, USA |
| Maria et al. [20] | Online survey | Statistical analysis, Negative Binomial Model | Significant decreases in the number and use of all means of transportation ; airplanes and buses are perceived to be the riskiest transport; 87.1% polled preferred to work in an online or remote setting | 10 countries |
| Zhang et al. [55] | Air passenger-level data from Travel Sky Departure Control System; Dynamic flight data | Descriptive, exploratory and statistical data analysis | Air passenger volumes declined significantly; 70% of people booked tickets within three days before travel; Refund and change rate of domestic airline tickets gradually decreased | China |
| Ku et al. [18] | Traffic survey; Seoul Metro data | Statistical analysis; Paired t-test | Existing bus and rail users have switched to the private auto mode; Usage rates of private vehicles and public bicycles have increased; Bus and rail passenger service rates have decreased | Seoul, Korea |
| Singh and Gupta [36] | Online questionnaire survey | Statistical and Descriptive data analysis | Significant number of persons shift from transport to a private mode; 67% of persons are working from home; An increase in the psychological burden due to lockdown/ quarantine | Delhi, India |
| Politis et al. [28] | Two Questionnaire surveys | Ordinary Least‐Squares regression models | Number of daily trips per person was on average decreased by 50%; Trips on foot were increased; Public transport modes were heavily reduced; Trip durations were generally increased | Thessaloniki, Greece |
| Politis et al. [29] | Questionnaire survey | Socioeconomic and statistical analysis | Decrease in trip frequencies due to the lockdown; Have significant correlations between gender, income and trip frequencies | Greece |
4.1. Road traffic safety
Road traffic accidents particularly in non or even no injuries were reduced as a result of the required social shutdown rules due to COVID-19, not including incidents leading to severe or fatal injuries. Following the first month of the COVID-19 epidemic [31], investigated at the variation in accidents and fatalities among different age motorists and pedestrians. Adults aged 80 and up would experience a correspondingly bigger decline than other motorists and pedestrians, according to these researchers. Zhang et al. [55] have been using the Negative Binomial (NB) approach to determine the impact of COVID-19 on the people engaged in collisions while controlling for the severity of various preventive strategies. They observed that the overall people miles traveled on the major traffic mode per person per day, as well as the percentage of business trips taken, have a beneficial impact on the number of people involved in car accidents. Even throughout COVID-19 pandemic, safety consciousness, mobility, and mobility patterns are all tightly linked, and hence have an indirectly impact on the number of accidents. Considering three separate data sets in Qatar, Alhajyaseen et al. [3] studied the situation of road security and public opinion of highway safety during the COViD-19 epidemic. The overall rate of accidents in Qatar throughout COVID-19 was much lower than in the past five years, but the rates of severe and fatal casualties climbed substantially. Gupta et al. [10]investigated the effect of shutdown strategies used to combat COVID-19 on-road casualties, using a generalized linear mixed method for analyses in fifteen nations due to the seriousness of the pandemic. The results of this model also showed that strict shutdown restrictions as well as a high level of residential movement decreased the Accident Fatalities and injuries Ratio. During the period of total lockdown in Nepal, Sedain and Pant [34] summed it up of road accident and fatalities. There seemed to be a decrease in the number of vehicle accidents, damages, and deaths, the decrease was not as significant as expected due to the severe limits on moving vehicles enforced during the shutdown. Saladié et al. [33] investigated the impact of the Spanish government's COVID-19 restriction on road traffic fatalities in the region of Tarragona (Spain). Throughout the COVID-19 shutdown, total movement in Tarragona state decreased by 62.9%, whereas road fatalities decreased by 74.3%. Their results add to the growing body of information that the COVID-19 epidemic is wreaking havoc on transportation safety. Vanlaar et al. [48] examined self-reported unsafe driving behaviors in Canada and the United States during the epidemic to see if there are any distinctions. The majority of participants stated that overall activity had not changed, while a minor percentage stated that they were less inclined to interact in such risky driving practices. When comparison to that before COVID-19, a large percentage of people said they were more inclined to engage in unsafe driving behaviors during the epidemic. Sekadakis et al. [35] used three distinct Seasonal Autoregressive Integrated Moving Average (SARIMA) time series models to assess the impact of the COVID-19 epidemic on road traffic crashes, fatalities, and injuries. The total number of road accidents, fatalities, and minor injuries fell as a result of the substantial reduction in traffic volume, according to the modeling results. Another conclusion was that the number of fatalities and minor injuries increased dramatically during the shutdown and the following month.