1. Introduction
Access to modern energy is instrumental for welfare, guarantee adequate health conditions, protect the environment, and promote socio-economic development (Rahut et al., 2019), which impacts directly on sustainable development (Ki-moon and Yumkella, 2010). However, poor and developing countries face a persistent deficit of electricity and a significant share of the population has little access to modern energy and technologies (Sarkodie and Adams, 2020). Currently, worldwide some 1.1 billion people (i.e. 14% of the global population) have no access to electricity, while 2.8 billion lack access to clean cooking fuels (Rahut et al., 2019). Other people, mainly from rural areas, rely on poor-quality electricity and frequent blackouts (Hountalas and Mavropoulos, 2010; Kamalimeera and Kirubakaran, 2021).
The limited and unreliable access to clean energy in poor and developing countries, drives the extensive use of traditional biomass fuels that represents a daily economic burden in rural areas, additionally increasing deforestation (which makes it harder to find firewood increasing the economic costs and collection time) and greenhouse gas (GHG) emissions (Rahut et al., 2019; Smith and Avery, 2014). Currently, traditional biomass fuels support 80% of the rural energy demand (Kamalimeera and Kirubakaran, 2021), driving different environmental, social, economic, and public health issues (Surendra et al., 2014). While firewood is renewable, its traditional use for cooking is unsustainable with severe environmental consequences (Sagastume et al., 2020).
In Africa, where the demand for firewood accounted for 70% of deforestation in 2010 and is estimated to increase to 83% by 2030, the use of small-scale digesters could reduce firewood-based deforestation by 4–26% by 2030 (i.e. 9–35% of the deforestation projected for 2030) (Subedi et al., 2014). Likewise, in rural China, where the lack of affordable and reliable energy is a barrier to economic growth, firewood demand-driven the exploitation of forests beyond their sustainable capacity (Ding et al., 2012). Moreover, in Colombia, low-income rural households rely on the more accessible and affordable firewood for cooking with high health, environmental, economic, and social costs (Pizarro-Loaiza et al., 2021).
Household biogas production from biomass wastes is a rather secure energy source unaffected by fuel price fluctuations as compared to fossil fuels (Ioannou-Ttofa et al., 2021). Household digesters can be a circular economy and food security strategy, additionally upgrading health and sanitation by addressing solid waste management (Kamalimeera and Kirubakaran, 2021). Particularly, in isolated rural communities with limited or inexistent energy infrastructure, small-scale household digesters are a simple and effective way towards more holistic farming systems that reduce the demand for traditional biomass fuels and chemical fertilizers, while improving welfare by providing clean energy for cooking, lighting, food preservation, heating, indoor air quality and health (Hijazi et al., 2019; Orskov et al., 2014; Smith and Avery, 2014). Decentralized and hybrid technologies have already provided access to electricity for an estimated 1.6 to 2 billion people in remote areas not connected to central electric grid systems (Kamalimeera and Kirubakaran, 2021; Mandal et al., 2018). However, a wider implementation of small-scale digesters has been precluded by environmental, socioeconomic, and cultural barriers (Mwirigi et al., 2014).
The biogas potential of organic wastes has been discussed in different studies. In Iran, the biogas potential from livestock manure coincides with an estimated 3–34% of the natural gas demand in seven provinces (Noorollahi et al., 2015). Moreover, in Nigeria, in urgent need to address the highly erratic electric system causing daily blackouts up to 20 h, livestock manure stands as an opportunity for biogas-based electricity production (Adeoti et al., 2014). In China, an estimated 50–66% of the renewable energy target could be supported by the biogas potential identified for 60% of the unused livestock manure (Bao et al., 2019).
Different studies discussed the implementation of small-scale digesters in rural areas worldwide. In Ecuador, the biogas potential from livestock manure in rural areas, can potentially replace the demand for LPG and support 90% of the rural electrification target, while mitigating GHG emissions (Cornejo and Wilkie, 2010). Moreover, in Colombia, a small-scale digester implemented in rural areas with daily input of 50 kg of cow manure (i.e. the manure produced from 3 cows corralled 60% of the time), provided enough biogas to support the cooking needs of five people (Castro et al., 2017). In Cajamarca (Peru), nearly 100 digesters were installed for cooking and lighting in different biogas programs since 1988, although different barriers led to abandoning the program and most digesters after a few years (Garfí et al., 2014). A new project in 2007 implemented plastic tubular digesters that, even under suboptimal operation, produced enough biogas to support 60% of the cooking needs, reducing firewood consumption, deforestation, and GHG emissions by 50%–60% while increasing income by 3%–5.5% (Garfí et al., 2012, 2014). In the Peruvian Andes, the implementation of rural household biogas digesters led to poverty alleviation, upgrading health conditions and agricultural yields, while reducing the demand for firewood, deforestation, and GHG emissions (Ferrer-Martí et al., 2018; Garfí et al., 2012, 2014). In China, governmental policies promoting household digesters in rural areas since the 1970s lead to some 10% of the rural families relying on biogas by 2005, reducing the per capita rural household energy by 10% and the demand for chemical fertilizers by 51% (Ding et al., 2012; Yu et al., 2008).
The use of LPG (liquified petroleum gas) has been suggested to reduce the demand for traditional biomass fuels (World Bank, 2014), but high acquisition and transporting costs prevented the expansion of this alternative (Garfí et al., 2019). Thus, household digesters rise as a significant alternative to reduce the demand for traditional biomass fuels. Addressing barriers to small-scale digesters necessitates the standardization of efficient technologies, higher public awareness of the integrated production of biogas and biofertilizer, and access to funding and adequate policies (Smith and Avery, 2014). Currently, the economic performance of household digesters strongly depends on subsidies (Wang et al., 2016). Therefore, policies must consider that the use of traditional fuels in households is influenced by income, tradition, gender, etc., being predominant in low-income families making subsidy important (Rahut et al., 2019). In general, the successful development of biogas projects in developed countries highlights the potential to replicate these outcomes in developing countries, where, regardless of the abundance of feedstock, biogas projects are frequently economically unfeasible (Khan and Martin, 2016).
In Colombia, electricity is available in 48% of the national territory providing access to 96% of the population (Gómez-Navarro and Ribó-Pérez, 2018), while two million people live in non-interconnected areas (52% of the national territory) including 1.2 million people with no access to electricity (Gaona et al., 2015). Other people are provided with costly, intermittent, and poor-quality electricity that can be limited to 4–8 h daily (UPME, 2016a). Particularly, cooking accounts for 66% of the end-use energy in the residential sector, where 11% of the 1.7 million households rely on firewood that represents 41% of the end-use energy (i.e. between 7% in urban areas and 83% in rural areas) using cooking systems with energy efficiencies around 3% (UPME, 2020a). Additionally, artisanal industries in rural areas further promoted the demand for firewood, contributing to deforestation (Hoffmann et al., 2018). In the country, the health costs associated with the use of firewood are estimated at 0.22% of the GDP (GASNOVA, 2018). Therefore, Colombia is challenged to provide access to electricity and clean energy to upgrade the welfare of rural and low-income families. In the country, biomass account for the highest renewable potential estimated in 58,611 GWh excluding forestry, from which some 10,000 GWh could be technically exploited (Gonzalez-Salazar et al., 2014a). A different study estimated that the anaerobic digestion of agricultural, livestock, and slaughterhouse wastes can yield some 63,000 GWh of energy (66% of the potential obtained from agriculture and agro-industrial wastes) (Sagastume et al., 2020). This potential could replace 25% of the national electricity generated in 2018 and 90% of the demand for natural gas and LPG in Colombia.
The department of Cordoba has large areas of an unmanaged forest threatened by deforestation (Delgado et al., 2020; UNDP, 2019). In the department, around 32% of the households (i.e. 4% in urban areas and 66% in rural areas) rely on firewood for cooking, using the traditional three-stones system with thermal efficiencies around 3% (Consorcio Estrategia Rural Sostenible, 2019; UNDP, 2019). Other fuel sources used for cooking in rural areas include LPG (28%), natural gas (4%), and electricity (1%) (with thermal efficiencies of 35–50%) (Kurchania et al., 2010; Ltodo et al., 2007; Shen et al., 2018; UNDP, 2019; UPME, 2020a). On average, collecting firewood for cooking requires around 96 h per month contrasted to the 24 h needed to manage biogas digesters (Consorcio Estrategia Rural Sostenible, 2019). Therefore, anaerobic digestion can address the demand for firewood in rural households while mitigating GHGs and improving welfare.
The costs of LPG averaging 50 USD per month plus 25 USD of transporting costs from urban to rural areas, prevents a wider use (Garfí et al., 2019). Overall, 4% of the households lack access to electricity, increasing to 20% in some rural areas (UPME, 2020b), evidencing sharp differences in the access to public services between urban and rural areas (Delgado et al., 2020).
Livestock and agricultural wastes, widely available in Cordoba, can become a source of clean energy for cooking and electricity in rural areas (Sagastume et al., 2020). Furthermore, a total of 67% of the GHG emissions in the department result from the enteric fermentation of livestock, deforestation, manure management, and the use of cooking fuels (IDEAM, PNUD, 2016). Therefore, the use of livestock and agricultural wastes can mitigate GHG emissions by addressing the management of manure and reducing the demand for firewood reducing energy poverty, thus, reducing deforestation. However, before anaerobic digestion can become a reality for low-income and rural citizens, is necessary to identify the current potential of livestock and agricultural wastes for biogas production. Consequently, this study aims at defining the biogas-based energy potential of livestock and agricultural wastes in the department of Cordoba. This is a first step to promote household digesters in the department, by providing decision-makers with useful information to support the development of new projects, the implementation of the renewable policies available, and, if necessary, the development of new policies.
2. Materials and methods
This section explains the materials and methods used in this study. It includes the relevant information of the department of Cordoba and the methods to estimate the renewable potential from agricultural and biomass wastes.
2.1. Household digesters
Household biogas digesters are frequently built between 2 and 10 m3 with 40–90 days retention time (Jegede et al., 2019; Nguyen et al., 2019). Anaerobic digesters include the Chinese dome, the Deenbandhu, the floating dome, the Taiwanese bag, and the prefabricated design (Jegede et al., 2019). The volumetric biogas production rate of household digesters usually ranges from 0.15 to 0.30 , while the average cooking demand of biogas varies from 0.2 to 0.3 (Deng et al., 2020). Household digesters lose between 1.7 and 8% of the CH4 with fugitive emissions, contributing to global warming and climate change (Bruun et al., 2014; Flesch et al., 2011).
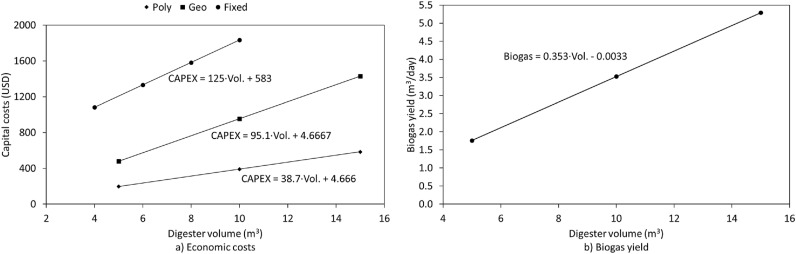
The most used household digesters include the fixed-dome in China, the floating drum in India, and the balloon/bag digester in Latin America (Figueroa et al., 2017; Ioannou-Ttofa et al., 2021). Floating drum designs have the highest capital costs with a lifespan of 15 years, contrasted with fixed dome digesters are less costly and have a lifespan of 20 years (Yasar et al., 2017). Moreover, tubular digesters have lower costs and lifespans between 5 and 10 years depending on the materials (Ferrer-Martí et al., 2018). Table 1 shows the capital investment and installation costs for the fixed dome and tubular digesters (i.e. polyethylene and geomembrane digesters).
Table 1. The capital cost of the fixed dome and tubular digesters (FAO, 2021; Ferrer-Martí et al., 2018).
| Digester size (m3) | CAPEX (USD) | OPEX (USD/year) | Total (USD) | ||||||
|---|---|---|---|---|---|---|---|---|---|
| Poly. | Geo. | Fixed | Poly. | Geo. | Fixed | Poly. | Geo. | Fixed | |
| 4 | – | – | 1083 | – | – | 43 | – | – | 1949 |
| 5 | 198 | 480 | – | 794 | 961 | – | 992 | 1441 | – |
| 6 | – | – | 1333 | – | – | 53 | – | – | 2399 |
| 8 | – | – | 1583 | – | – | 63 | – | – | 2849 |
| 10 | 392 | 956 | 1833 | 1568 | 1912 | 73 | 1960 | 2868 | 3299 |
| 15 | 585 | 1431 | – | 2341 | 2863 | – | 2926 | 4294 | – |
*Poly. – Polyethylene, Geo. – Geomembrane.
The CAPEX and biogas production data were correlated to estimate the costs and biogas yields for different volumes of digesters (see Fig. 1).
 Fig. 1. Digester cost and biogas yield (own elaboration with data from Table 1).
Overall, fixed dome digesters have a higher cost than tubular digesters.
In Colombia, household digesters have little implementation, mostly limited to the installation of tubular polyethylene digesters in small-scale farms (Garfí et al., 2019). In Cordoba, the number of people per household averages 3.3 (DANE, 2018). Thus, an average of 0.7–1 is needed to supply the cooking demand in the department, which requires a 3 m3 digester.
The capital costs required to implement a digester on households relying on firewood is calculated as:(1)where:
-
– Capital costs of digesters for households relying on firewood (USD)
-
– Capital costs of the digester (USD/digester)
-
– Households relying on firewood
Moreover, there are 14,474 households with no access to electricity in the department. Using biogas to provide the basic subsystem consumption to these households requires small-scale generators. To this end, the use of biogas generator units in capacity to generate from 0.85 to 1 kW for 1000 USD per unit was considered (BISON, 2021).(2)
-
– Capital costs of electric generator units for households without access to electricity (USD)
-
– Capital cost of biogas generator (USD/generator)
-
– Households without access to electricity
In this case, the capital costs depend on the investment in the digester needed to support the biogas production required by the generator.
2.2. Departament of Cordoba
There are 1.56 million people in the department, of which 47% reside in rural areas (DANE, 2018). Moreover, there are 466,615 households, with 43% located in rural areas and 28% located in the capital city (Montería) (DANE, 2018). Furthermore, an average of 7% of the rural population lack access to electricity, which increases to 28% in some municipalities. Moreover, over half of the rural population depends on firewood for cooking. On the other hand, there are important amounts of agricultural and livestock wastes available in the department, which combined with deforestation, account for a significant amount of the departmental GHG emissions.
2.2.1. Firewood demand
In the department, firewood is used in open fire systems, with thermal efficiencies ranging from 1 to 17% (Carranza and Gutiérrez, 2012), which averages 4.4% in Colombia (Consorcio Estrategia Rural Sostenible, 2019). As compared, standard gas stoves that are fueled with LPG or natural gas, operates with thermal efficiencies ranging from 35 to 50% (Kurchania et al., 2010; Ltodo et al., 2007; Shen et al., 2018; UPME, 2020a), while biogas stoves operate with thermal efficiencies around 37.2% (i.e. around 12% of the total energy from firewood).
In total, an estimated 150,717 households rely on firewood for cooking, accounting for 4.1% of the urban households (i.e. around 10,458 households) and 66.3% of the rural households (i.e. around 140,259 households) (UNDP, 2019). Fig. 2 shows the estimated distribution of urban and rural households consuming firewood.
 Fig. 2. Estimated households depending on firewood in urban and rural areas (Own elaboration with data from (DANE, 2018; UNDP, 2019)).
Nine municipalities with over 6000 households relying on firewood account for 56% of the total households (i.e. Cereté, Ciénaga de Oro, Lorica, Sahagún, San Andrés, San Pelayo, Tierralta, Tuchín). Considering a monthly average demand of 367 kg of firewood per household (Consorcio Estrategia Rural Sostenible, 2019), the demand for firewood in the department is estimated at 663,762 t per year. Based on a biomass yield of 96.2 t per ha for natural forests in Cordoba, the demand for firewood drives the deforestation of some 6900 ha per year (Yepes et al., 2011). Given a firewood heating value of 16.9 MJ/kg, the firewood demand for cooking is equivalent to some 11,279 TJ/month (UPME, 2016b). Contrasted, the use of gas stoves would require between 993 and 1418 TJ/year (i.e from 9 to 13% of the energy from firewood), while the use of biogas requires some 1334 TJ (i.e. around 12% of the energy from firewood).
2.2.2. Access to electricity in Cordoba
In Colombia, the government defined a basic subsistence consumption (BSC, i.e. the electricity threshold monthly required to satisfy the basic needs of the average household) (UPME, 2011). Currently, the BSC is defined between 130 kWh/month per average household for lower temperature regions and 187 kWh/month for tropical weather regions (Superservicios, 2017). However, in several rural areas countrywide the electricity consumption averages 60 kWh/month per household (Minenergía, 2019; UPME, 2012). Moreover, the United Nations defined an energy threshold to meet basic human needs in 100 kWh of electricity and 100 kg of oil equivalent of modern fuels per year, which coincides with the emissions of 0.41 tCO2eq. per capita (Chakravarty and Tavoni, 2013; González-Eguino, 2015; Ki-moon and Yumkella, 2010).
The demand for electricity varied from 1477 to 1426 GWh between 2016 and 2017 (Ramírez et al., 2018). While the average access to electricity varies from 93% in rural areas to 99% in urban areas, there are eight municipalities (i.e. Ayapel, Montelíbano, Puerto Libertador, San Andrés, San José de Uré, Tierralta, Tuchín, Valencia) where the access ranges from 72% to 86%. These data show the limited access to electricity in some areas of the department.
2.2.3. Agriculture in Cordoba
Agriculture is one of the main economic activities of the department. In total, 40 annual, permanent, and short period crops are harvested in the department, while most of the production results from seven crops (MINAGRICULTURA, 2017). Fig. 3 shows the agricultural production of these crops in the department.
 Fig. 3. Agricultural production in Cordoba (MINAGRICULTURA, 2021).
In total, the agricultural production of the main crops accounts for 0.9 to 1.2 million t of products per year. In this case. The seven largest crops average 88% of the agricultural production in the department.
Agricultural production in the different municipalities is shown in Fig. 4.
 Fig. 4. Average agricultural production by municipalities in the department of Cordoba between 2010 and 2019 (MINAGRICULTURA, 2021).
In total, the production from Tierralta, C. de Oro, and Lorica account for 34% of the departmental production, while Momil, Purísima, and San José account for a low 1%.
2.2.4. Livestock in Cordoba
Cordoba is one of the main producers of bovine livestock in Colombia. Fig. 5shows the heads of livestock under production in the different municipalities.
 Fig. 5. Heads of livestock in the department (MINAGRICULTURA, 2021).
In total, there are 2.1 million heads of bovine livestock, 0.3 million heads of porcine livestock, and 3.5 million heads of poultry livestock. The municipalities of Lorica, Montería, and Sahagún account for 39% of the livestock in the department, while La Apartada, San Antero y San Jose account for a limited 1%.
2.2.5. GHG emissions
The department of Cordoba accounted for the emission of 6.7 million tCO2eq. in 2012 (IDEAM, 2016; UNDP, 2019). Table 2 shows the share of emissions by source in the department.
Table 2. GHG emission in the department of Cordoba (IDEAM, PNUD, 2016; UNDP, 2019).
| Source | Emissions (%) |
|---|---|
| Livestock | 49.24 |
| Forestry | 20.92 |
| Manufacturing industry | 14.24 |
| Transport | 8.36 |
| Others | 7.24 |
In total, livestock and forestry account for some 70% of the departmental GHG emissions, mostly affected by the enteric fermentation of bovine livestock, removals of firewood and carbon from soils in natural forests, direct and indirect emissions from manure and urine during livestock grazing, fuel combustion in the residential and commercial sectors, bovine manure management, and deforestation of natural forests (IDEAM, 2016). Countrywide, deforestation account for 98% of the emissions from forestry. Moreover, the carbon balance and regeneration of natural forests, seasonal crops, and grasslands account for 76% of the 0.9 million tCO2eq. absorbed in the department. Overall, livestock manure, agriculture, and forestry have a large influence on the net GHG emissions of the department.
The emissions of GHGs in this study were calculated as:(3)where:
-
– Biomass waste i
-
– Emission factor of GHGs for biomass waste i
Table 3 shows the heating value and GHG emission factor for different cooking fuels used in the residential sector.
Table 3. Characteristics and emission factor of selected cooking fuels (UPME, 2016b).
| Parameters | Biogas (m3) | Natural gas (m3) | Electricity (kWh) | LPG (kg) | Firewood (kg) |
|---|---|---|---|---|---|
| HHV (MJ/unit) | 24.4 | 39.5 | – | 49.1 | 18.3 |
| LHV (MJ/unit) | 22.0 | 35.7 | – | 45.4 | 16.9 |
| Emission factor (tCO2/TJ) | 84.4 | 55.5 | 55.3 | 67.2 | 89.5 |
| Emission factor (kgCH4/TJ) | 1 | 1 | 3 | 1 | 30 |
| Emission factor (kgN2O/TJ) | 0.1 | 0.1 | 1 | 0.3 | 4 |
| Emission factor (tCO2eq./TJ) | 84.4 | 55.6 | 55.4 | 67.2 | 91.4 |
*Equivalent CO2 of CH4 (28 kgCO2eq.) and N2O (265 kgCO2eq.) (CML - Department of Industrial Ecology, 2016)
The table shows that firewood account for the highest specific GHG emissions, which is aggravated by the inefficient use of firewood for cooking. Moreover, natural gas and electricity account for the lowest specific emissions.
Based on the emission factor of firewood and using the average demand for firewood in Colombia, the GHG emissions resulting from the use of firewood for cooking are estimated for the municipalities in Cordoba (see Fig. 6).
 Fig. 6. Estimated GHG emissions from firewood in Cordoba (DANE, 2018).
In total, GHG emissions from firewood are estimated at 1 million tCO2eq.. The capital Montería (the largest municipality), with the highest urban and rural populations in the department, accounts for 13% of the GHG emissions, while five other municipalities emit over 50,000 tCO2eq..
2.3. Biomass-to-energy potential
The process of anaerobic digestion results in the production of biogas (i.e. a mix of CH4 and CO2). In households, this process is developed in small-scale digesters using the substrates available. While biogas is a fuel used for heat and power production, the digestate byproduct serves as fertilizer (Mayer et al., 2019).
The biochemical methane potential (i.e. the methane yield from anaerobic digestion) for lignocellulosic biomass is calculated like (Thomsen et al., 2014):(4)where:
-
– Biochemical methane potential of biomass source i
-
– Cellulose fraction of biomass source i
-
– Hemicellulose fraction of biomass source i
-
– Lignin fraction of biomass source i
-
– Fraction of the remaining biomass constituents of biomass source i
Moreover, for manure (i.e. non-lignocellulosic biomass), the BMP is calculated like (Sagastume et al., 2020):(5)where:
-
– Specific biochemical methane potential of biomass source i
-
– Mass of manure
-
– Total solids
-
– Volatile solids on a dry basis
Finally, to calculate the technical methane potential (TMP) that account for the biomethane that can be technically exploited, is calculated as (Wang et al., 2018):(6)were:
-
– Technical methane potential of biomass source i
-
– Feedstock specific heat .
-
– Digester operational temperature (°C)
-
– Average atmospheric temperature (°C)
-
– Low heating value of methane (kJ/m3)
Finally, the BMP for each source of biomass is calculated like:(7)where:
– Biomethane energy potential from biomass source i (TJ).
Finally, the total BMP for the biomass sources available is calculated like:(8)
The cooking potential of a biomass source is:(9)where:
-
– Cooking energy potential from the biomethane for biomass source i (TJ)
-
– Cooking efficiency (%)
The total cooking potential is then calculated like:(10)where:
– Total cooking energy potential from the available biomass sources (thermal efficiencies of 35–50% are considered for LPG and natural gas) (TJ).
To calculate the electric potential of biomethane it is considered an electricity efficiency of 30% for biogas systems (Pöschl et al., 2010), with a self-consumption of 20% for the technology used to produce electricity (Dong et al., 2018):(11)where:
-
– Electricity potential from biomass source i (TJ)
-
– Electricity efficiency
The total electricity potential is then:(12)
-
– Total electricity potential from biomass sources (TJ)
2.4. Demand for biogas energy
The biogas-based energy required to replace the consumption of firewood in the average household (i.e. consuming 367 kgfirewood/month) is calculated as:(13)where:
-
– Specific biogas-based energy required to replace the consumption of firewood
-
– Mass of firewood (367 kg/month)
-
– Low heating value of firewood (16.9 MJ/kg)
-
– Efficiency of firewood cooking system (4.4%)
-
– Efficiency of biogas cooking system (37.2%)
Moreover, the biogas-based energy demand required at municipal and departmental levels is calculated as:(14)where:
-
– Biogas-based energy required to replace the consumption of firewood
The biogas-based energy demand to meet the BSC at municipal and departmental is calculated as:(15)
-
– Biogas-based energy required to support the generation of electricity
-
– Households without access to electricity
-
2.5. Characteristics of biomass
Table 4 shows the waste factors and other characteristics of the biomass wastes considered in this study.
Table 4. Waste factors, characteristics, and TMP from crop wastes.
| Crop | Waste | Moisture (%) | XC(%) | XH(%) | XL(%) | VSdb(%) | Waste factor (t/tproduct) | BioCH4(m3/tVS) | BMP (m3/t) | TMP (m3/t) |
|---|---|---|---|---|---|---|---|---|---|---|
| Cassava | Stalks | 16 | 23 | 29 | 22 | 80 | 0.09 | 227.6 | 153.6 | 151.9 |
| Rhizome | 8 | 34 | 17 | 28 | 77 | 0.49 | 198.7 | 140.3 | 138.6 | |
| Plantain | Pseudo-stem | 90 | 54 | 16 | 21 | 89 | 3.00 | 248.2 | 22.0 | 20.4 |
| Maize | Stubble | 8 | 45 | 25 | 15 | 73 | 0.93 | 276.5 | 185.8 | 184.2 |
| Cob | 7 | 28 | 26 | 19 | 74 | 0.27 | 245.5 | 170.1 | 168.5 | |
| Stover | 7 | 40 | 25 | 14 | 75 | 0.21 | 278.3 | 194.8 | 193.2 | |
| Yam | Waste yam | 12 | 40 | 30 | 67 | 66 | 0.07 | 11.4 | 6.7 | 5.0 |
| Rice | Husk | 23 | 35 | 25 | 20 | 69 | 0.20 | 244.6 | 130.2 | 128.5 |
| Coconut | Husk | 10 | 39 | 20 | 37 | 81 | 0.34 | 159.0 | 115.4 | 113.7 |
| Cotton | Stalks | 7 | 38 | 32 | 21 | 74 | 1.77 | 244.4 | 168.6 | 166.9 |
*XC – cellulose, XH – hemicellulose, XL – Ligning, VSdb – Volatile solids on dry basis.
Pseudo-stem from plantain production shows the highest moisture and waste factor, while waste yam and cassava stalks show the lowest waste factors. Moreover, most wastes show TMP values higher than 110 m3/t, except for waste yam and plantain pseudo-stem.
Table 5 shows the waste factors and other characteristics of the manure wastes considered in this study.
Table 5. Waste factors, characteristics, and biomethane yields from manure.
| Livestock |
Manure |
TS (%) | VSdb(%) |
BMP |
VS |
BMP |
TMP |
|
|---|---|---|---|---|---|---|---|---|
| Bovine | < 1 year | 1460 | 10.5 | 74.7 | 0.18 | 114.5 | 20.6 | 18.5 |
| 1–2 years | 3285 | 257.7 | 46.4 | 41.5 | ||||
| 2–3 years | 5110 | 400.8 | 72.1 | 64.6 | ||||
| > 3 years | 6570 | 515.3 | 92.8 | 83.1 | ||||
| Porcine | Piglets (1–60 days) | 102 | 26.8 | 74.2 | 0.21 | 20.3 | 4.3 | 4.1 |
| Growers (61–120 days) | 445 | 88.5 | 18.6 | 17.9 | ||||
| Finisher (121–180 days) | 799 | 158.9 | 33.4 | 32.2 | ||||
| Replacing sows (120–240 days) | 1971 | 391.9 | 82.3 | 79.4 | ||||
| Breading sows (> 240 days) | 2694 | 535.7 | 112.5 | 108.5 | ||||
| Boars (> 180 days) | 2051 | 407.9 | 85.6 | 82.6 | ||||
| Backyard pigs | 799 | 159.0 | 33.4 | 32.2 | ||||
| Poultry | Fattening | 26 | 32.2 | 65.2 | 0.23 | 5.4 | 1.2 | 1.2 |
| Growing | 38 | 8.0 | 1.8 | 1.8 | ||||
| Egg production | 38 | 8.0 | 1.8 | 1.8 | ||||
| Reproduction | 38 | 8.0 | 1.8 | 1.8 | ||||
| Backyard chicken | 38 | 8.0 | 1.8 | 1.8 | ||||
*TS – Total solids.
Bovine heads show the highest TMP per head, except for breading and replacing sows, and boars which account for a little share of the livestock in pig breeding systems. Moreover, while the TMP per head of poultry is low compared to bovine and porcine livestock, poultry breeding systems include more heads per surface area as compared to bovine and porcine systems.
3. Results
The results describe the available biomass for biogas production and its energy potential.
3.1. Available agriculture and livestock biomass
Fig. 7 shows the agricultural wastes resulting from the production of the main crops in the department.
 Fig. 7. Crop wastes in the department.
In total, 1.2 million t of wastes result from agriculture on yearly basis. Some 38% of the crop wastes are generated in Lorica, Monitos, and Tierralta. Plantain, maize, and cassava account for the highest production of crop wastes in the department.
Fig. 8 shows manure available in the municipalities for the livestock considered. In the case of bovine livestock, it is considered that the livestock is corralled 60% of the time (Castro et al., 2017).
 Fig. 8. Livestock manure available for recollection in the department.
In total, bovine manure accounts for 41–92% of the available manure in the municipalities, while porcine manure represents from 5 to 51%, and poultry manure accounts for 1–23%. In the department, bovine accounts for 84% of the 2.2 million t of manure available, while porcine accounts for 10% and poultry manure account for 6%.
Table 6 summarizes the waste products from agriculture and livestock in the department.
Table 6. Agriculture and manure waste products in the department of Cordoba.