1. Introduction
Osteoporosis affects 200 million women [1]. For the population over 50 years old, it is estimated that the percentages of men and women with osteoporosis are, respectively: 16.0% and 29.9% in the USA [2], 6.8% and 22.5% in European Union [3], 6% and 23% in Australia [3], 6.46% and 29.13% in China [4]. In Latin America, estimates of hip fractures for women and men aged from 50 to 64 years old indicate an increase of 400% between 1990 and 2050; a growth around 700% for the population over 65 years old [1]. In Brazil, over 10 million people have osteoporosis (one in 17 people); however, only a third of patients with osteoporotic hip fracture is diagnosed and a fifth of such patients receives treatment [5], [6].
In six European nations (France, Germany, Italy, Spain, Sweden, and the UK), 2.7 million osteoporotic fractures occur every year with an associated healthcare expenses of US$40.7 billion; it is expected a 23% cost increase by 2030 (US$ 51.7 billion) [7]. Among Medicare beneficiaries (American Healthcare Trust Fund), there were 2.3 million osteoporotic fractures in 2015; costs of US$57 billion were estimated in 2018 with an expected increase over US$95.2 billion in 2040. Such estimates take into account the population aging and growth [8].
Bones provide structural support for locomotion, protection of internal organs, calcium and phosphate storage, as well as produce hormones to regulate mineral and energy metabolism [9]. Total bone mass is composed of, approximately, 80% of cortical tissue and 20% of trabecular tissue, but their proportion varies in each bone, establishing the bone’s strength. For example, long bones have more cortical tissue and vertebrae contain more trabecular one [10]. Trabecular bone is less dense and more flexible and fragile than cortical bone, presenting higher metabolic activity [11].
During their life cycles, bones are continuously renewed through a remodeling process (composed of two phases resorption and regeneration) for skeletonadaptation to mechanical stress as well as for fracture healing. Bone resorption without proper reposition by specialized cells reduces mass and causes micro architectural deterioration of the tissue. When a clinically significant imbalance occurs, the individual is diagnosed with osteoporosis; that is, a systemic skeletal disease that causes bone fragility and susceptibility to fracture [12]. Osteopeniais also associated to reduced bone mineral content, being less severe than osteoporosis. After the age of 20, bone resorption becomes predominant in men and its mineral content declines about 4% per decade. Females generally maintain the peak mineral content until menopause; thereafter, it declines about 15% per decade [13], first affecting the trabecular bone [12]. Osteoporosis affects to all old individuals [14]. Above a third of older women and a quarter of older men have fractures related to fragile bones [8]. Some people have osteoporosis at an earlier life stage due to illness, medication or hormonal deficiency [15]. Frequent intake of glucocorticoids (recommended for inflammatory rheumatic diseases and lung disorders) doubles the risk of fractures in both sexes [16]. Other risk factors are: smoking, alcoholism, physical inactivity, and improper diet. Based on the etiology, osteoporosis is classified as primary (due to genetic illnesses and aging) or secondary (caused, for example, by immunosuppressive drugs).
Osteoporosis has no symptoms and most people are diagnosed when fracture occurs due to disease severity [17], [18]. Such fractures lead to chronic health problems. Its global impact is increasing due to population aging, demanding worldwide efforts to prevent bone fractures [11], [19], [20]. Screening to find out high risk population eligible to treatment (among others, administration of calcium and vitamin D) may reduce social and economic burden.
A common diagnostic test for osteoporosis is bone densitometry. Dual-energy X-ray absorptiometry (DXA) is pointed out by the World Health Organization (WHO) as the gold standard to measure bone mineral density [13]. Based on such measurement, diagnosis of osteoporosis and the assessment of fracture risk has been carried out. However, WHO also suggests the investigation of alternative technologies for such purpose [21]. Currently, there is no accepted policy to identify patients with high risk of fracture in Europe [22]. Thus, there is a clear need for technology development to complement the existing procedures for osteoporosis diagnosis, aiming to improve the results as well as to reduce the associated technological costs in order to allow an universal coverage.
Unlike other reviews, this survey does not only focus on current methods to assist the osteoporosis diagnosis, but also discusses technologies that have been investigated to enhance osteoporosis management and reduce exam costs. Thus, the reader has a scenario of current trends and efforts to develop technologies to characterize bone health.
The remainder of this text is structured as follows. Section 2 describes the literature review (database, search terms, inclusion and exclusion criteria). Section 3 presents the current technologies available in the market to assist osteoporosis diagnosis. Section 4 reports new approaches that have been been investigated for this purpose. Section 5 discusses the current scenario and concludes this review.
2. Search Methodology
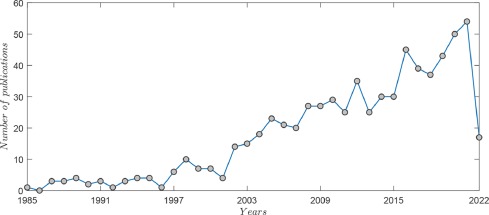
There is a vast literature on osteoporosis screening methods; thus, it was necessary to limit the search scope. Using the words ”osteoporosis + screening”, search in the Scopus database (title, abstract and keywords) resulted in 687 records from 1985 to 2022 (Fig 1). As observed in Fig 1, there was significant increase of publications in the last 20 years. It shows that the population aging has raised concerns about the impact of osteoporosis on public health.
 Fig. 1. Number of publications in the field of osteoporosis screening methods in the period between 1985 and 2022 (www.scopus.com, consulted 05/05/2022) (Keywords: Osteoporosis + screening).
Search for the words ”osteoporosis + review” found out 33 records published between 1968 and 2022 (Fig 2). Most reviews discuss medical perspectives on treatments, clinical diagnosis, prevention, and cost-effectiveness. Search for the words ”osteoporosis + technologies” had only three findings [23], [24], [25]. During our searches, a paper was found that discusses current applied technologies without presenting new technologies being investigated for such purpose as carried out in this review [26].
 Fig. 2. Number of publications in the field of osteoporosis review methods in the period between 1968 and 2022 (www.scopus.com, consulted 05/05/2022) (Keywords: Osteoporosis + review).
We could not find any manuscript that surveys current and emerging technologies applied to diagnosis of osteoporosis, aiming to provide a wide view of the technological challenges in this field. Hence, this review summarizes the working principles of different technologies for osteoporosis diagnosis, highlighting their advantages and limitations.
3. Current Applied Technologies
Currently, there exist several commercial devices and computer tools to assist osteoporosis diagnosis. However, all of them have limitations, as pointed out in the following subsections, demanding additional developments to circumvent them. This section is presented according to the structure of Fig 3.
 Fig. 3. Scheme of the current technologies for osteoporosis diagnosis.
3.1. Dual-energy X-ray Absorptiometry
DXA is considered the gold standard for measuring bone mineral density (BMD), since it has been intensively investigated and validated worldwide. DXA systems generate X-ray beams with two different levels of energy. The absorption of the high (e.g. 71 keV) and low (e.g. 39 keV) energy beams by the different body tissues allows the quantification of BMD. Bone minerals (e.g. calcium) absorb more low energy X-rays beams than soft tissues. The attenuation imposed by soft tissues to the X-ray beams in body regions without bones is used as a baseline measurement. Bone mineral content is then estimated by subtracting attenuation ratio between low and high energy X-rays through tissue and bone from the baseline measurement. The system also does a X-ray sweep on the region of interest in order to provide images. There are differences among DXA systems of different manufacturers regarding to X-ray beams generation, energy range, X-ray detectors, and body sweeping method [27].
BMD () is given by the ratio between the measured bone mineral content (grams) and the measured area of the bone (). For diagnosis purpose, bone density values are usually reported as standard deviation units related to the normal probability density distribution of a uniform Caucasian female control group [28], the T-score:(1)where is a new BMD measurement, and are the mean and the standard deviation of the normal distribution, respectively. The reference values for normal subjects, low bone density (osteopenia), and osteoporosis are respectively: T-score -1, -1 T-score -2.5, T-score -2.5 [21].
BMD should be measured from posterior-anterior spine (L1 to L4, excluding the ones with structural damage) and hip (lowest BMD value between proximal femur or femoral neck). In case of hyperparathyroidism or obesity, BMD may be measured from forearm (1/3 distal radius).
BMD measurements in children, who have not achieved their peak bone mass, is carried out by means of the Z-score. Z-score can be calculated similarly to Eq. 1, replacing the control group values (mean and standard deviation) for those of a matched population taking into account the same age range, gender, and ethnicity. Z-score is also recommended for prior menopausal women and men under 50 years. A Z-score of -2.0 or lower is defined as ”below the expected range for age” and a Z-score above -2.0 is ”within the expected range for age” [21].
Despite being largely used, the analyzes of DXA measurements demand attention. Since BMD is based on X-rays attenuation, lumbar vertebracompressed by a fragility fracture may generate measurement artifact; a high BMD value may be related to an increased vertebra thickness instead of high mineral content. To circumvent that, if a BMD measurement obtained for given vertebra is very large when compared to the others, it shall be excluded from the calculated indices.
As mentioned, T-score is calculated using a control group as reference. Ideally, there should be available an ethnically-defined reference database for each examined subject. That is particularly difficult to manage in nations with large racial diversity [29].
Different manufacturers do not use a common database or a same technology to generate their measurements. Therefore, follow-up of patients should be conducted in the same facility, same bone region, and same device [19]; even though, database or device software may be updated. Thus, BMD is more suitable for patient monitoring instead of T or Z-scores. Besides, operators should be trained as correct patient positioning should be observed [29]. Quality control procedures should be weekly followed to assure repeatability of DXA measurements. Such aspects hamper the follow-up of patients’ treatment.
The American College of Physicians points out that there are no evidences to recommend DXA monitoring for patients with normal BMD, neither during the initial five years of pharmacological treatment of osteoporosis [30]. Besides, the cost of DXA devices is high, generally over US $35,000. Thus, further development of currently investigated technologies may provide more powerful tools to improve osteoporosis screening.
Quantitative indices of hip geometry calculated from DXA images have been investigated to assess fracture risk [31], [32]. Researchers have proposed a statistical model based on joint BMD and femur shape measurements to improve hip fracture risk assessment when compared to that carried out by only T-score [33]. Currently, only proximal hip axis length (HAL) index (distance from the inner pelvic brim to the greater trochanter) is recommended to assess hip fracture risk of postmenopausal women [28].
It has been pointed out that quantitative indices obtained by DXA overlook localized bone weakness, hampering the diagnosis. Complementary techniques have been proposed to improve the patient’s evaluation such as vertebral fracture assessment and trabecular bone score.
3.1.1. Vertebral Fracture Assessment
Lateral spine images for vertebral fracture assessment (VFA) may be acquired by DXA when measuring BMD. Such method allows a radiation dose 200 times lower than that of standard X-ray devices, being less expensive [34]. DXA images of vertebrae superior to T7 have inferior quality when compared to those of standard radiographs, but their fracture is relatively uncommon in older women [35].
Fractures have been identified by lateral spine images in patients with and without osteoporosis according to the BMD criteria; such findings influence the prescription of preventive medication to avoid new vertebral and non-vertebral fractures [36].
The International Society for Clinical Densitometry (ISCD) recommends VFA when T-score is inferior to -1 associated to one (or more) of the following conditions: women above 70 years, men above 80 years, height loss superior to 4 cm, previous vertebral fracture, glucocorticoid therapy for three months [34]. The United Kingdom National Osteoporosis Guidelines Group (UK NOGG) recommends VFA for postmenopausal women as well as for men age 50 years and older who have height loss equal or greater than 4 cm, kyphosis, recent or current long-term oral glucocorticoid therapy, or a BMD T-score -2.5 at either the spine or hip, or in cases of acute onset back pain with risk factors for osteoporosis [37].
3.1.2. Trabecular Bone Score
Bone resistance to fractures is determined by many factors, such its micro and macro structures, BMD, and adjacent tissues (e.g., cartilages, muscles). Such complementary factors shall be analyzed when BMD alone does not explain increased fracture risk (e.g., presence of desmophytes in vertebral column) [38], [39].
Trabecular bone score (TBS), obtained from DXA images, indirectly assesses the trabecular microstructure. A heterogeneous bone density causes irregular photon absorption that can be detected by grey level changes among pixels belonging to two-dimensional (2D) lumbar spine DXA images. The so-called variogram is the sum of the squared grey level differences between pixels at a specific distance. TBS is calculated as the slope of the log-log transform of the 2D variogram to characterize the rate of grey level amplitude variations. A high TBS value is related to fracture-resistant bone [39].
Since DXA image resolution (0.5 mm) is not enough to solve bone microstructure, TBS is actually related to macroscopic vertebrae features resulting from microarchitectural arrangements. TBS is affected by soft tissue composition and thickness. Such factors may be compensated by software adjustments that take into account body mass index (BMI). As TBS comes from DXA images, its measurements depend on proprietary manufacturers’ technologies [40], [41].
Recent work did not find relation between TBS and a vertebral fracture severity index based on VFA; the authors suggested the use of both indices to characterize bone strength [42]. A similar result was found when comparing TBS to quantitative ultrasound (QUS), suggesting that both techniques assess different characteristics of bones [43].
TBS has been pointed out as an useful index to assist the osteoporotic fracture risk assessment of postmenopausal women and men older than 50 years [44], [45], [46]. It may be also useful to assess patients with osteophytes, since such condition leads to inaccurate BMD measurements [47], [48]. However, it shall not be used for patients’ follow-up, since its value is not proportional to BMD increasing [41], [49]. Additional research is recommended to better establish its applicability [50], [51], [52].
3.2. Quantitative Computed Tomography
Computed tomography (CT) generates cross-sectional images after processing multiple X-ray planes acquired at different body angles. For that, X-ray beam and detectors are rotated around the patient during the exam [53], [54]. Thus, a CT scan is assembled based on a set of images (usually contiguous) obtained from the area of interest. The grey-scale of CT images is associated to the relative attenuation imposed by the interrogated structures, being estimated for each region of the cross-sectional image.
Quantitative computed tomography (QCT) allows the analysis of CT images beyond a visual radiological evaluation. Quantitative parameters are measured from structures and texture of bone images [55], [56], [57]; for instance, vertebral strength has been estimated by finite element analysis of QCT scans [58].
QCT is generally obtained from lumbar spine and hip by means of standard whole-body CT scanners and dedicated software. Other bones investigated by QCT are proximal femur, forearm, and tibia [56], [59].
QCT plays an import role in the osteoporosis diagnosis since it provides selective trabecular BMD measurement (tissue more affected by metabolic diseases) and has superior soft tissue differentiation [60].
Since DXA is used as gold standard, its comparison to CT has been recently carried out [56], [61], [62]. For instance, fracture risk indices estimated from DXA-based (two-dimensional) and CT-based (three-dimensional) finite-element models have shown significant correlation [63]. However, CT provides a better sensitivity and more accurate data [26], [59], [63].
In contrast to DXA, all CT scanners are similarly calibrated [55]. QCT is less susceptible to confounding factors such as superimposition of overlying structures, spinal degenerative changes, aortic calcification, bone size, and BMI [61]. Thus, femoral neck and total hip T-scores calculated from two-dimensional projections of QCT data are considered equivalent to DXA T-scores for diagnosis of osteoporosis [27]. However, movement artifacts during QCT scanning can lead to misinterpretations [53].
QCT is a complex procedure with low availability, high cost, and relative high radiation exposure [26], [55], [59]. To circumvent these two last aspects, researchers propose opportunistic screening when CT scans obtained to assess other health conditions (acquired from chest, abdomen, pelvis, and spine) are used to diagnose osteoporosis. [61], [64], [65].
Multivariate linear regression analysis (MLRA) has been successfully applied to QCT, assisting the evaluation of osteoporosis in subjects with normal glucose tolerance, impaired glucose tolerance, and diabetes [66].
A deep learning model was used to analyse processed images of upper lumbar vertebrae obtained by means of low dose chest CT, ordinarily used for early lung cancer diagnosis. The proposed system had good performance to automatically detect osteoporosis and low BMD [61].
Recently, hip fracture risk prediction was assessed by means of a partial least square based statistical model of the proximal femur taking into account three-dimensional bone geometry measurements and BMD distribution obtained by CT. Results of the proposed model applied to a sample group of 100 Caucasian women show that it substantially enhances fracture risk prediction when compared to areal BMD measured by DXA [67].
In a clinical study with 98 prostate cancer patients using a combination of FRAX(Section 3.5) and mean attenuation of the mid-L5 vertebra measured from pelvic CT, the assessment of hip fracture risk was not significantly improved [68]. Among other factors, the results were associated to the small number of only male subjects.
CT-based and FRAX without BMD (FRAXwb) predictors were investigated to improve the detection of high fracture risk individuals [65]. A CT-based prediction tool based on linear regression was developed, using as input three bone imaging biomarkers along with age and sex data; contribution of FRAXwb to the CT-based prediction tool was also assessed. The authors concluded that when FRAXwb input is not available, the initial evaluation of fracture risk can be carried out automatically based on a single abdomen or chest CT.
Biomechanical computed tomography (BCT) has been proposed to identify high fracture risk patients based on both femoral strength and hip BMD T-scores [69]. The clinical outcomes were obtained using a four states Markov model along a year, which includes: presence and absence of hip fractures, osteoporosis treatment, and bone’s death (absorbing state). BCT also comprises a virtual stress test, advanced medical image processing, bone biomechanicsconcepts, and non-linear finite element analysis to predict typical fracture [70].
Cone beam computed tomography (CBCT), used in oral and maxillofacial surgery, has been investigated as a screening tool for early detection of osteoporosis and subsequent referral [71]. As advantage, CBCT offers lower radiation exposure than QCT. In [72], the diagnosis of osteoporosis is proposed for postmenopausal women with normal BMD by using a composite osteoporosis index (three-dimensional mandibular osteoporosis index: 3D MOI) measured by CBCT. 3D MOI showed good performance to assess, qualitatively and quantitatively, osteoporosis in the mandibular cortex.
3.2.1. Peripheral Quantitative Computed Tomography
Peripheral QCT (pQCT) consists of the application of QCT to appendicular skeleton sites, such as arms or legs. Compared to general CT scanners, pQCT devices have similar data acquisition and reconstruction procedures, but have higher mobility, employ less radiation, and have lower cost [55], [73].
High-resolution pQCT (HR-pQCT) allows a much more detailed follow up of patients under treatment compared to DXA [74], [75]. HR-pQCT has also been successfully applied to analyze subchondral trabecular bone in patients with medial knee osteoarthritis [76]. Assessment of trabecular bone architecture and BMD at the distal radius and tibia by HR-pQCT has shown reproducibility and ability to detect aging and disease-related changes [77].
Lately, finite element (FE) models and pQCT have also been successfully applied to compute bone strength and stiffness of forearm (i.e. distal radius) [78]. It was observed that FE modelling allows the assessment of osteoporotic bone strength. FE modelling was also employed to identify patients with peripheral low-trauma fracture. Therefore, pQCT-FE enhanced the diagnosis when compared to standard pQCT and DXA [79].
3.3. Magnetic Resonance Imaging
Magnetic resonance imaging (MRI) is often used for visualization of human organs due to its inherent soft tissue contrast. For that, static and transient magnetic fields are applied to the body. Excited hydrogen atoms of the interrogated tissues (contained, mainly, in water and fat) emit radio frequency (RF) signals while returning to their equilibrium state. The RF signals are sampled by the device receiving coils; their processing allows the characterization of tissues from different body layers.
Bone structure and texture attributes have been obtained from MRI images to characterize vertebral fragility or fracture. For that, MRI images are usually pre-processed and segmented, before having the features extracted and classified. Further development of these methods may provide tools for opportunistic screening of osteoporosis [80], [81].
As trabecular marrow contains water and fat, MRI systems (1.5, 3, and 7 Tesla) have been applied to characterize trabecular micro-architecture [82], [83]. The investigations have been carried out for small populations (n100, being n the number of patients). Results of comparative analyses point out that the MRI may allow identification of patients with fracture risk not detected by DXA [82]. Relaxation times and rates (inherent to MRI technology) are also used to investigate trabecular structure and bone density [84].
Visualization of cortical bones requires MRI system with advanced feature (ultra-short echo time) to acquire RF signals from water belonging to cortical microscopic pores and matrix collagen. Quantitative indices to characterize the cortical strength have also been proposed [82].
Advances of MRI technology allowed the inclusion of magnetic resonance spectroscopy (MRS) on the investigation of organs metabolism [85]. As the name suggest, MRS assesses the frequency content of the received RF signals to characterize the composition of bone marrow; its composition may be related to osteoporosis pathophysiology. As different devices use different software to analyze MRS data, researchers may have large variability among their results [85], [86].
MRI does not involve ionizing radiation, but it is an expensive and a time consuming exam. Techniques for its application to characterize bones are being further developed.
3.4. Quantitative Ultrasound
Methods based on ultrasound have been intensively investigated to provide an alternative to DXA. They aim to be non-invasive, portable, safer (ionizing radiation free), and less expensive technology.
However, quantitative ultrasound (QUS) systems present drawbacks similar to those of DXA. The manufacturers apply different technologies to carry out measurements; thus, different devices provide different quantitative values for a same subject from different skeletal sites [87]. Technologists properly trained shall follow quality control protocols to calibrate the devices. Operator may have impact on the reproducibility of measurements performed by a same device. Due to such aspects, the International Society for Clinical Densitometry (ISCD) recognizes the potential of heel QUS to assess fracture risk, pointing out that it is not effective for monitoring treatment efficacy [88].
3.4.1. Cortical Quantitative Ultrasound
The cortical bone is a dense tissue that surrounds the trabecular one in order to increase the overall mechanical strength of each skeletal component; even though, it has a porous network. Its external surface is named periosteum and its interface with the internal trabecular tissue, endosteum. With aging, the cortical tissue becomes thinner and more porous [89]. Several ultrasound technologies have been proposed to estimate the cortical thickness in order to assist screening and osteoporosis diagnosis.
Pulse-echo Method An ultrasound burst (3 MHz) is applied by means of a focused transducer to interrogate the bone (radius or tibia). Two reflected pulses are received by the same transducer from the periosteum and endosteum interfaces due to acoustic impedance mismatches. The envelopes of the two received bursts are calculated by applying the Hilbert transform. The time interval between their peaks is multiplied by the speed of sound to estimate the cortical layer thickness (Ct.Th). Anthropometric data and Ct.Th measured from different sites (distal radius, proximal and distal tibia) are used to calculate an index named density index (DI). Studies carried out for relative small groups of Caucasian women (n1000) have shown that DI may assist the screening of patients with osteoporosis [90], [91].
Further developments of the technology may provide a low-cost device for osteoporosis diagnosis. Despite being commercially available, their clinical application has not been validated yet by means of studies in large multi-racial populations.
Axial Transmission The outer cortical shell of bones is often modelled as a transverse isotropic free plate [92], since it has different acoustic properties from the surrounding soft tissue and internal trabecular tissue. Other models have also been investigated [93], [94], but the plate model matches reasonably well to the acoustic transmission observed in experimental setups [95].
In the free plate model, an incident ultrasound pulse causes the propagation of longitudinal and shear waves that interact to generate, as result (depending on the cortical layer thickness and ultrasound frequency), multiple resonant vibration modes known as Lamb waves. They are symmetric and anti-symmetric waves (having the longitudinal axis as reference) that propagate independently of each other.
In axial transmission, an ultrasound probe containing an array of transducers (transmitters and receivers) is placed on the interrogated bone (usually radius or tibia). A transmitted pulse (200 kHz to 1 MHz) is sampled by each receiver (placed at different distances from the transmitter). Owing to the complex Lamb waves propagation, each receiver samples signals that have different waveforms. The array of sampled waveforms (distance vs time) is processed to obtain a two-dimensional (2D) spatio-temporal Fourier transform. From the 2D Fourier transform, the phase velocity of each guided wave mode can be obtained as they correspond to the temporal evolution of local spectral peaks. Theoretical modes computed for the free plate model are fitted to such experimental measurements. As the theoretical model is based on physical parameters (such as Young’s modulus), bone properties can be estimated; that is called model-based inversion method.
The initial studies on axial transmission of acoustic waves in bones observed a first arriving signal (FAS) as part of the received ultrasound burst. With the posterior application of Lamb’s theory, FAS was associated to the fundamental symmetric Lamb wave [60] for applied acoustic wavelengths comparable or greater than the cortical thickness; such acoustic waves have a larger penetration depth, interrogating deeper bone layers. The FAS velocity (vFAS) has been obtained by measuring the delay between the instant of application and the initial reception time of the ultrasound pulse; knowing the distance between the transducers (transmitter and receivers), the propagation velocity(vFAS) is calculated.
Based on vFAS and phase velocity of other Lamb modes, characteristics (porosity and thickness) of the cortical bone have been investigated. Ex vivo and in vivo studies have been carried out to compare the estimated cortical properties to those measured by computed tomography [75], [96], [97], [98]. Future investigations shall allow the improvement of current QUS devices that apply such method.
Meanwhile, axial velocity of ultrasonic waves was employed to assess antiresorptive therapies in a small population (n = 468); it was observed an increase of the velocity measured from tibia over five years when compared to a control group [99].
Velocity of ultrasonic waves along the axial direction has also been investigated at relative high-frequency (3 MHz) to assess the bone microstructure. The purpose is to associate bone anisotropy to the measured velocity in order to assess the tissue integrity [100].
A different approach used a hydrophone to sample, at four different axial distances, acoustic pulses applied to the tibia by an ultrasound probe; based on arrival time measurements of waves propagated to two nearby distances, a median velocity was obtained. For a small in vivo sample (n = 27), such median propagation velocity was successfully used to identify three sets of subjects: healthy (n = 13), osteopenic (n = 8), and osteoporotic (n = 6). In this work [101], the authors also modeled the waveform received by the hydrophone as consisting of superimposed multiple echoes from bone (different vibration modes) and soft tissues (interfering signals). To identify the different contributions, the received signal was decomposed in five modes by means of Variational Mode Decomposition (VMD) [102]. Measurements of the median velocity for the mode with maximum power (obtained by VMD) presented better performance than the direct velocity estimation to detect osteoporotic bone.
Transverse Transmission Commercial ultrasound systems also carry out measurements from hand’s phalanges. Usually, they measure the time taken by an ultrasound pulse to travel across the distance between two aligned transducers placed on opposite sides of the distal metaphysis; it corresponds to the interval between the pulse application time and the instant when the received signal first achieves the amplitude of 2 mV. The so-called amplitude-dependent speed of sound (AD-SoS) is obtained by dividing such time interval by the distance between the transducers [103]. The mean AD-SoS measured from phalanges of the non-dominant hand has been correlated to BMD measured by DXA [104]. AD-SoS measurements have also been associated to age-related changes in bone mass during pubertal years [105].
3.4.2. Cancellous Quantitative Ultrasound
There are many commercial devices that carry out different quantitative measurements from the heel. 90% of the calcaneus (heel bone) consists of trabecular bone tissue where initial loss of bone mass occurs. The heel can be easily handled; besides, it is not surrounded by a large amount of soft tissue that could hamper the analysis of the results.
Transverse Transmission The velocity and attenuation of ultrasound waves propagating across different materials depend on their physical properties. Velocity depends on the Young’s modulus and density; attenuation is related to acoustic impedance, scattering, and absorption. Thus, velocity and attenuation measurements of acoustic waves are associated to characteristics of the interrogated tissue.
To assess the calcaneus, QUS systems usually measure the speed of sound (SoS) and broadband ultrasonic attenuation (BUA). These indices have shown good performance to predict fractures risk [106].
For that, a piezoelectric transducer is used to apply a short duration acoustic wave that, after travelling across the heel, is received by a second transducer (aligned at a fixed or adjustable distance). For acoustic impedance matching, the transducers may be coupled to the heel by means of gel or water; it depends on the system manufacturer. Reference measurements from degassed water are obtained for the ultrasound system. The time interval for the applied pulse to reach the receiver is measured using only water (reference), and later, with the placement of the patient’s heel; the difference between these measurements allows the estimation of SoS () [107]. Technical approaches to carry out such measurement were reviewed [108].
BUA measurement is more complex, since attenuation depends on the ultrasound frequency. As a short acoustic pulse has a broad range of frequencies, discrete Fourier transform is applied to the sampled received signal in order to obtain the amplitude of each frequency component. Attenuation measurements are carried out for frequencies ranging from 300 to 700kHz [108]. Within such range, attenuation is higher for increasing frequencies (linear trend). Thus, it is possible to fit a straight line to the experimental data set(attenuation vs frequency). The angular coefficient of the fitted line is the BUA (dB/MHz). Such index divided by the heel thickness () is named normalized BUA (nBUA); it allows the comparative analysis of measurements carried out from different subjects.
The propagation of acoustic waves through bone is quite complex since its tissue is anisotropic and inhomogeneous. Several models have been proposed and several experiments have been carried out to better understand it [109].
Among these models, Biot’s theory describes longitudinal waves that travel at different velocities (fast and slow) in fluid-saturated porous media, such as the trabecular bone. Fast transmission occurs when solid (trabecular structure) and fluid (bone marrow) move in phase; slow transmission corresponds to solid and fluid moving out of phase during the wave propagation [110]. Experimental results characterized their different interactions with bone tissue. For higher bone densities, propagation velocity of the fast wave increases (2200 to 2700 m/s), being almost constant for the slow wave (about 1400 m/s). Such velocity is almost independent of the applied ultrasound frequency for a range between 0.5 and 5 MHz. The attenuation constant of the slow wave increases with bone density; for the fast wave, the attenuation constant is much higher, but independent of bone density. Based on the velocity and amplitude of the received waves, equations were proposed to estimate the bone elasticity and bone density [111]. The study has shown significant correlation of such measurements with those obtained by peripheral quantitative computerized tomography for an Asian population (n = 52) [112].
Backscatter Processing Ultrasound systems also obtain quantitative measurements by processing the backscattered waves. In pulse mode, ultrasound echoes of cancellous bone come from interfaces among the solid trabecular network (rod-like or plate-like) and the marrow. Therefore, they are composed of multiple interfering contributions due to random scatters. The backscattered signal also depends on the ultrasound wavelength, geometry and orientation of the trabecular structures relative to the incident wave. Several quantitative indices obtained from backscattered ultrasound have been proposed to characterize bone density and microstructure [108]. In vivomeasurements have shown moderate correlation between proposed backscatter indices and BMD measured by DXA [113], [114]. Based on backscatter indices, ultrasound parametric imaging for ex vivo bone samples has been investigated [115].
Ultrasound medical images are built based on echoes originated from tissue boundaries at different body depths; brightness of image pixels are associated to amplitudes of the returned echoes. For two dimensional visualization of a given anatomical structure, the ultrasound system scans consecutive body slices. The radiofrequency echographic multispectrometry (REMS) system generates conventional images and stores the unprocessed backscattered (also called radiofrequency - RF) signals from 100 scans (frames) of the interrogated body region; usually, lumbar spine (L1-L4) or femoral neck. Custom-implemented algorithms automatically identify signals backscattered from the vertebrae and select an analysis region using a spectral model database as reference. Next, spectra of the patient’s RF signals are compared to those of age-matched models (51-55 and 56-60 years old) previously classified by means of DXA as osteoporotic, osteopenic or healthy [116]. Studies carried out for Caucasian populations (n 1640) showed good performance of REMS measurements when compared to those obtained by DXA [117], [118]. The European Society for Clinical and Economic Aspects of Osteoporosis, osteoarthritis and musculoskeletal diseases (ESCEO) states that the REMS has the potential to become the first clinically available method for direct non-ionizing measurement of lumbar and femoral BMD [119].
3.5. Clinical Tools
BMD measured by DXA has low sensitivity to assess fracture risk since other factors are involved. The fracture risk assessment tool (FRAX is a computer-based algorithm that, based on multiple clinical risk factors, estimates the 10-year probability of a major fracture (hip, vertebrae, humerus or wrist fracture)). The risk factors are previous fragility fracture, parental hip fracture, smoking, systemic glucocorticoid intake, excessive alcohol consumption, rheumatoid arthritis, and secondary causes of osteoporosis (e.g., type I diabetes, chronic malnutrition, endocrine disorders); besides, age, sex, and BMI are taken into account. BMD measured from the femoral neck may also be used as an optional input. The fracture probability also involves the risk of death [120], [121]. FRAX has low cost and may be used where other methods are not available.
FRAX, first released in 2008, has 71 models based on the epidemiology of fractures adapted for 66 countries. It is a tool recommended in more than 80 osteoporosis prevention guidelines around the world [120], [121], [122], [123].
FRAX algorithm has been improved over the time. There were adjustments to calibrate the results according to the time passed by after a fracture, since evidences indicate an increased risk of a new fracture after a recent one. Recently, an additional category, very high-risk, was included due to development of new treatment options. Thus, more modern and efficient drugs(anabolic therapy) may be prescribed for such patients while the high-risk patients continue receiving conventional drugs [124].
For example, the UK NOGG recommends major osteoporotic fracture (MOF) assessment of postmenopausal women, and men age 50 years or older by means of FRAX to classify patients in four risk groups: low, intermediate, high, and very high (Fig 4). Those with FRAX probabilities of 10-year MOF risk above UAT (high and very high risk patients), shall have their BMD measured to guide drug choice and provide a baseline for BMD monitoring. Those classified as intermediate risk patients (between UAT and LAT) are further assessed with BMD measurement; if new calculated probabilities using BMD lie above or below intervention (IT), it is recommended treatment or given lifestyle advice, respectively. If BMD measurements are not viable, intermediate risk patients with probabilities above IT are considered for treatment. Low risk patients do not require BMD measurements and shall modify their lifestyle [37].