1. Introduction
Navigation in ports has become significantly complex in the last decades. The progressive increment of maritime traffic has determined constantly growing pressures on port spaces (Bellsolà Olba et al., 2020), resulting in reduced maneuverability and a higher probability of close encounters or accidents. Furthermore, the global fleet is also growing in numbers (Perera and Soares, 2017), with a consequent increase of traffic in port accesses and transit areas. In addition, ships are growing in size (Tchang, 2020). Larger ships imply reduced maneuverability and therefore a greater risk of collision, especially in those ports where space is limited by physical obstacles or narrow maneuvering basins. Although conflict avoidance is a priority for many seaport systems, collisions remain the majority of all types of ship accidents to date (Debnath et al., 2011). The number of traffic movements in a port channel can in fact reach, for particularly busy ports, up to 2000 transits per day and this number is expected to increase (Yip, 2008).
Such increase of accidents led the scientific community to focus on the risks of maritime operations, and to question the paradox of having low safety standards within a low-cost transportation system (Kristiansen, 2013). In this regard, risk analysis methods for maritime transport have attracted an ever increasing interest, to the point that international organizations have committed to provide recommendations on the use of specific risk analysis and management tools (IMO, 2018).
However, collision risk in maritime transportation may come from very different types of hazard. Adverse weather, natural disasters, human error, uncharted waterways are just some of the specific threats which may endanger ships, goods, marine personnel, passengers or environment. Moreover, physical and logistical characteristics may differ greatly depending on the specific port, i.e. shape and size of the maneuver basin, traffic density, bathymetry, physical processes, prevalent metocean conditions etc.
All the aforementioned aspects, including the heterogeneity (or lacking) of available accident databases, pushed the safety science community to provide advanced tools for collision risk evaluation. In this regard, current literature on maritime risk assessment is thriving at an unprecedented pace, with numerous, new methodologies being developed every year. Nevertheless, they vary widely in terms of required input information, concept, mathematical model, field of application, scientific soundness and uncertainty evaluation tools. The key to any successful risk analysis also passes through the choice of the right method for the examined situation, which influences the accuracy of risk evaluation and the effectiveness of mitigation measures.
In the present work a literature review on ship collision risk assessment methods is presented, in which a range of relevant studies was analyzed and critically discussed. The paper focuses on new, cutting-edge technologiesdeveloped in the last decade, to provide an overview on future perspectives and challenges of maritime collision safety evaluation.
Particular attention is given to the risk assessment technologies and their state of the art, by discussing strengths and weaknesses of the employed methodologies. In comparison with previous reviews, which limited only to certain approaches or classified the methods based on the type of input data, herein the goal is to critically discuss the features of the employed technologies, by acknowledging their advancements as well as questioning their effectiveness and applicability. A classification based on technology allows for a deeper understanding of the potentials and limitations of different approaches and can provide guidance on which technologies may be most suitable for a given situation. In addition, a technology-based review can help to identify opportunities for future investments in new or emerging technologies to improve their effectiveness, reliability or cost efficiency.
In order to contextualize the reviewed works within the current literature and allow the comparison with previous studies, they were categorized according to state-of-the-art classifications (Goerlandt and Montewka, 2015b, Chen et al., 2019). Further development of established approaches and new methods are both included in the assessment. Furthermore, a detailed analysis on a database of ship accidents in port areas is presented, to analyze worldwide and Mediterranean trends.
The paper is structured as follows: Section 2 presents a data analysis on maritime accidents in port areas; Section 3 briefly introduces the risk definition adopted in the present work; Section 4 describes the classification methods used to categorize the different methods; Section 5 describes the methodology of the review process; Section 6 illustrates the reviewed literature; a critical discussion on the reviewed methodologies is provided in Section 7; finally, a conclusive chapter (Section 8) closes the work.
2. Analysis of vessel accidents in port areas
Understanding ship accidents distribution in terms of Grosse Tonnage (GT), typical age of the affected vessels, category of the ships, as well as distribution of underlying causes and consequences is the first necessary step to improve accident mitigation strategies.
Collection and analysis of ship accident data allow to identify patterns and trends that can be used to develop strategies for reducing frequency and severity of these accidents. In such an ever-changing scenario, up-to-date databases analyses are of paramount importance to track progress over time and to evaluate the effectiveness of risk mitigation measures. Identifying the type of ships or routes that are more likely to experience collisions, or that certain types of accidents are more common than others, is important as it allows to identify criticalities and opportunities for improvement.
To this aim, an analysis of a database of vessel accidents in port areas is herein presented. The accidents are analyzed in terms of relevant vessel characteristics such as age, GT and segment. Causes and consequences of the available accidents are discussed and a data analysis has been carried out.
The dataset was created starting from the following two databases:
-
•
SeaSearcher, which recorded 79,592 vessel accidents between 1967 and second quarter (Q2) of 2021;
-
•
IHS, which recorded 23,897 vessel accidents between 1990 and Q2 of 2021.
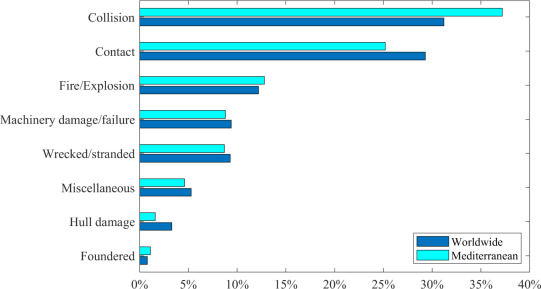
These two databases were compared considering International Maritime Organization (IMO) identification number, accident date and location (at sea or in port), in order to create a unified database with consistent data. In the event of common accidents found within the system (meaning findings with the same IMO number and the same accident date), the location was compared. If the two locations in the databases were not matching, the accident was not included in the unified database for the analysis. The final database comprises 13,846 accidents worldwide, of which 2799 occurred in port areas and 634 in Mediterranean port areas. Fig. 1 shows the distribution of accidents in Mediterranean’s and worldwide port areas by causality event.
The figure shows that the main causes of the accidents in the port areas regard collisions between two different vessels and this cause 31% accidents worldwide and 37% accidents in the Mediterranean area. Details about the weather conditions are unknown for most of the accidents included in the database, but heavy weather conditions results as a major cause of accidents in the port area when weather conditions are specified. The accidents have more or less serious consequences, and may have consequences on human life and on the total or partial loss of cargo, or the vessel itself. Worldwide, 3% of the accidents had consequences on human life while in Mediterranean ports this value increases, with 5% of the accidents having consequences on human life. For both worldwide and Mediterranean analysis, 2% of the accidents have reported a loss of cargo or of the entire ship. The vessel segment that reported more accidents, is the General Cargo, both for worldwide and the Mediterranean, followed by the Passenger Ro/Ro vessels, in the Mediterranean area, and Bulk carrier worldwide. This may be due to the fact that General cargo and Bulk carrier vessels constitute the most significant portion of the worldwide fleet. The range of the vessel’s age at the time of the accident that reported more accidents is between the 0–10 years for both the worldwide and the Mediterranean analysis. The ships with a gross tonnage between 500–5.000 GT are more involved in port accidents. This may be due to the large number of ships of the worldwide fleet with a tonnage comprised between 500 and 5.000 GTs. Further details on the data analysis are provided in a freely accessible Mendeley Data repository (Marino et al., 2022).
 Fig. 1. Distribution of accidents in Mediterranean’s port areas by causality event.
3. Definition of risk of collision
In the field of risk assessment, there is no univocal definition of risk. This concept has evolved with very different designations depending on risk perspective, risk perceiver and area of application. The Society for Risk Analysis defines “risk” as “the potential for the realization of unwanted and negative consequences to human life, health, property or the environment”. According to the definition of IMO, the risk is the result of the combination of frequencies of occurrence and the related severity of the consequences, with the frequencies traditionally defined by means of probability. A quantitative definition of risk, relating to an undesirable event , and widely used in the maritime sector is the one formulated by (Ayyub, 2003): (1)
Probability-based methods to assess risk are generally preferred as they provide quantitative and exhaustive results for both risk evaluation and mitigation, in combination with the estimation of its consequences (Chen et al., 2019). A widely applied probabilistic-risk definition framework is the one proposed by Fujii and Shiobara (1971) for the risk of collision, which is: (2)
According to Eq. (2), the collision probability is divided into two terms: the number of collision candidates, also known as geometric probability , which is related to strictly geometrical aspects of the encounter; and the causation probability , which includes components related to technical faults, failures, human reliability etc.
4. Classification of maritime risk assessment methods
According to Ozbas and Altiok (2012) risk analysis methodologies on maritime systems can be classified into two groups: (i) quantitative assessment of undesirable events, based on reliability analysis, modeling engineering tools or statistical data analysis; (ii) qualitative assessment, using expert or non-expert judgement,
Quantitative assessments aim at identifying an objective and quantifiable value for determining the components of the system that contribute to the risk. Although they are numerous in literature, their application is weakened by two main issues. First, data on port operations accidents are often incomplete, not available or do not exist at all. In addition, seaport conditions are constantly evolving due to changing traffic patterns, fleet size and environmental conditions. Data that might have been relevant to use, may not be anymore as the port asset is changed in the meantime. Second, accidents that occur with greater probability generate nearly insignificant consequences. On the contrary, severe accidents are generally more rare and quantitative data, even when systematically recovered, are often insufficient to obtain robust quantitative (e.g. statistical) analyses. Therefore, qualitative methods are of critical importance in those cases in which data availability is limited (Apostolakis, 1990).
According to Goerlandt and Montewka (2015b), three different approaches on the analysis of maritime risk can be distinguished: realist, constructivist and proceduralist approaches. Risk realists generally view risk as a physical attribute of the system, which can be defined by objective facts, and therefore controlled and predicted. These methods make use of quantitative information related to events and their relative consequences. On the other hand, risk constructivists generally consider risk as a social construct, which is attributed by risk-perceivers to a technology or a system, rather than being a physical part of it. Under this assumption, risk analysis depicts a mental/social construct of a group of assessors, which can be experts and/or non-experts. Finally, risk proceduralists lie halfway, i.e. risk is characterized through an integrated understanding of the whole system, balancing objective facts and perceived values, making use of both quantitative and qualitative data sources.
These three views are furtherly subdivided in the following approaches, which are schematized in the following:
-
(i) Strong Realist (SR) risk is factual and exists as an objective feature of the system, therefore risk analysis represents an estimation of a quantifiable physical attribute. The evaluation is based exclusively on data collected from the system or derived from engineering models; judgement of assessors, both experts or non-experts, is not considered. In this case, data regarding the uncertainty of the assessment is not provided. Stakeholders are generally not involved in the evaluation process.
-
(ii) Moderate Realist (MR). Analogous to the strong realistic approach, is largely based on quantitative data and on engineering models. Assessors’ judgement is considered, however non-experts are excluded and generally used as completion data. Uncertainty of evidence may be included.
-
(iii) Moderate Realist with Uncertainty assessment (MRU). Similar to the moderate realist approach but provides uncertainty assessments of results.
-
(iv) Scientific Proceduralist (SP) It is based both on quantitative data and/or engineering models, and on the judgement of assessors (both experts and non-experts).
-
(v) Moderately Constructivist (MC). Risk is a mental construct and risk analysis is described by its features as experienced by risk perceivers. It is based on both quantitative data and expert judgement. Risk assessment uncertainty is not evaluated and stakeholders are not involved in the evaluation process.
-
(vi) Precautionary Constructivist (PC). Similar to moderate constructivist, although separation between facts and non-epistemic values is considered relevant.
-
(vii) Constructivist (C). Similar to the moderate constructivist, evidence uncertainty may be considered.
-
(viii) Strong Constructivist (SC). Risk is analyzed as a mental construct, which involves primarily perceptive attributes. It is mainly based on the judgement of non-expert people, who can be informed by the judgement of experts. Uncertainty of evidence values may be considered.
Chen et al. (2019) developed a classification structure based on modeling aspects and parameters used to quantify risk. The categorization focuses on both technical features of the methods and the stakeholders to which they are specifically addressed.
-
(i) Synthetic Indicators (SI). They describe geometric risk probability by simple dimensional parameters, this includes Closest-Point of Approach (CPA), Distance to CPA, Time to CPA etc.
-
(ii) Safe Boundary Approach (SBA). These methods evaluate collision risk based on the superposition of ship domain and collision diameters
-
(iii) Velocity-based Approach (VA). Distances and velocities of collision candidates are presented in a velocity space and corresponding patch shadow area of the possible routes and consequent potential areas of impact.
-
(iv) Statistical Analysis Approach (SAA). Probabilistic analysis based on time series of accident datasets to investigate human and non-human factors in risk collision.
-
(v) Fault Tree Analysis (FTA). Inferential analysis of failure reports based on a deductive process using simple binary Boolean logic operators
-
(vi) Bayesian Approach (BA). Complex inference network with conditional probability operators to model multi-state causation relationships between contributing factors
5. Review methodology
An extensive literature review was carried out by using field-related keywords such as maritime safety, probabilistic risk analysis, ship–ship collision, maritime accident etc. A total of 50 papers were collected. The selection of papers was then narrowed down based on the following criteria: (i) maritime ship collisionrisk only, either considering ship–ship or ship–structure collision; (ii) year of publication (2016); (iii) papers not previously reviewed in other literature reviews; In the end, 36 papers from indexed journals and conferences were considered in the review process, those papers, their methodology and classification according to Goerlandt and Montewka (2015b) and Chen et al. (2019) are shown in Table 1. Fig. 2 shows the distribution of the papers per journals, with Ocean Engineering being the reference journal for ship collision risk assessment. Finally, Fig. 3 illustrates the distribution of the reviewed papers according to Goerlandt and Montewka (2015b) and Chen et al. (2019), showing a large majority of Strong Realist (71%) and Synthetic Indicator Approach (50%) methodologies.
 Fig. 2. Number of reviewed papers per journal.
 Fig. 3. Classification of the reviewed papers according to: Goerlandt and Montewka (2015b) (a), and Chen et al. (2019) (b). SR Strong Realist, SP Scientific Proceduralist, MC Moderately Constructivist, SI Synthetic Indicators, SBA Safe Boundary Approach, VA Velocity-based Approach, SAA Statistical Analysis Approach, FTA Fault Tree Analysis, BA Bayesian Approach.
Table 1. Reviewed articles and their classification following Goerlandt and Montewka (2015b) and Chen et al. (2019).
| Article | Methodology | Classification according to Goerlandt and Montewka (2015b) | Classification according to Chen et al. (2019) |
|---|---|---|---|
| Arici et al. (2020) | Fuzzy bow-tie risk analysis | MC | FTA |
| Aydin et al. (2021) | Fuzzy Bayesian network | MC | BA |
| Chen et al. (2021) | Velocity obstacle | SR | VA |
| Fan et al. (2020a) | Tree augmented network | SR | BA |
| Feng (2019) | Convolutional Neural Network | SP | SI |
| Hu and Park (2020) | Fuzzy logic and Analytical Hierarchy Process | SP | SI |
| Hu et al. (2020) | Fuzzy C-means algorithm | SR | SI |
| Jiang et al. (2020) | Bayesian Network | SR | BA |
| Li et al. (2018) | Adaptive Fuzzy Neural Network | SR | SI |
| Liu et al. (2020) | Recurrent Neural Network | SR | SBA |
| Liu et al. (2022) | Safe domain and SVM | SR | SI |
| Ma et al. (2022) | HFACS, DEMATEL model and Fuzzy Cognitive Map | SR | SAA |
| Namgung et al. (2019) | Closest point of approach and ANN | SR | SI |
| Qiao et al. (2020) | Dynamic fuzzy Bayesian network | MC | BA |
| Rong et al. (2019) | Closest point of approach | SR | SI |
| Rong et al. (2022) | Closest point of approach | SR | SI |
| Sakar et al. (2021) | Fault-tree analysis and Bayesian network | SR | FTA |
| Ziqiang et al. (2022) | Fuzzy logic and Analytical Hierarchy | SR | SI |
| Silveira et al. (2021) | Multi-criteria decision approach | MC | SI |
| Sokukcu and Sakar (2022) | Fault-tree analysis, Bayesian network and Fuzzy logic | MC | FTA |
| Ugurlu and Cicek (2022) | Fault-tree analysis | SR | FTA |
| Ung (2019) | Fault-tree analysis, Bayesian network and CREAM model | MC | FTA |
| Wang et al. (2016) | Analytical Hierarchy Process and ANN | SP | SI |
| Wu et al. (2019) | Fuzzy logic | SR | SBA |
| Xie et al. (2019a) | Beetle Antennae search algorithm | SR | SI |
| Xie et al. (2019b) | Q-learning beetle swarm antenna search | SR | SI |
| Xie et al. (2020) | Long short-term neural network and Q-learning | SR | SI |
| Yıldırım et al. (2019) | Human Factors Analysis and Classification System | SP | SAA |
| Yoo and Lee (2019) | Closest point of approach | SR | SI |
| Yu et al. (2021) | Bayesian network and Evidential Reasoning | SP | BA |
| Yu et al. (2022) | Multi-criteria risk assessment | MC | SI |
| Zhang and Meng (2019) | Critical ship safety distance | SR | SBA |
| Zhang et al. (2020) | Convolutional Neural Network | SR | SBA |
| Zhen et al. (2022a) | Multi-ship encounter arena model | SR | SI |
| Zhen et al. (2022b) | Multi-ship encounter model | SR | SI |
| Zheng et al. (2020) | Support Vector Machine | SR | SBA |
6. Review of risk analysis methods
The methodologies to assess ship collision risk are discussed herein. New technologies alongside well-established approaches are included, analyzing the most recent advancements from past literature and providing a glance on future perspectives. Rather than following the aforementioned classifications, the reviewed methods were broken down by technology, in order to easily introduce the basics and discuss perspectives and challenges of each methodology.
6.1. Geometric indicators approaches
Geometric Indicators Approaches (GIAs) consist in the calculation of dimensional quantities related to ship position and velocity, which allow to define potential risk based on geometric parameters. One of those GIAs is the Synthetic Indicators approach. Synthetic indicators are quantities that describe the distribution in space and time of a potential encounter. A widely used method is the Closest Point of Approach (CPA) and its related parameters: Distance to CPA (DCPA), which means the closest distance between two ships and Time to CPA (TCPA), which is the time left to the CPA point (Fig. 4a). Synthetic indicators reflect the projected spatio-temporal encounter scenario assuming that every ship maintains speed and route over the whole potential conflict. The methods that employ CPA can provide a quantitative risk estimation of the probability of occurrence, which can be implemented in radar systems or into a navigation aid systems (Bukhari et al., 2013, Wang et al., 2017).
Thanks to their simplicity, these methods won a certain popularity in the last decades (Mou et al., 2010, Debnath and Chin, 2010, Goerlandt et al., 2015, Zhang et al., 2015, Zhen et al., 2017). However, their application is limited to the collision risk between one Own Ship and one or more Target Ships, making the method generally unsuitable to model multiple ship encounters.
 Fig. 4. Schematization of Closest Point of Approach (a) and Safe Domain (b) where L is vessel length.
A step forward in this sense was done by Rong et al. (2019), who developed a model based on risk synthetic indicators, TCPA and the relative distance between ships, to obtain collision risk maps. Three-month Automatic Identification System (AIS) data were used to identify 1671 near collision scenarios off the Coast of Portugal, with 827, 384 and 460 being overtaking, crossing and head-on collision scenarios, respectively. They adopted the Kernel Density Estimation method to obtain maps of near-collision. The analysis of the maps showed overtaking collisions occur more frequently along the main shipping routes, whereas crossing and head-on near collisions tend to occur at junction areas.
More recently, Rong et al. (2022) proposed a novel approach to identify risk ship collision using synthetic indicators and a Sliding Window Algorithm. This algorithm is formed by a “window” that can slide along the data to capture different portions of them (Keogh et al., 2001). The authors use this algorithm to identify the ship trajectory. In particular, it allows to obtain better performance in trajectory feature extraction compared with other algorithms due to its efficacy to identify the ship’s situational information in near-collision scenarios. They used three-month AIS data to identify 2846 encounter scenarios off the coast of Portugal. However, AIS data are not synchronized at the same time. To overcome this limitation, the authors adopted a cubic spline interpolation. They calculated TCPA and DCPA to identify near-collision scenarios. In particular, the majority of encounter scenarios are represented by overtaking scenarios. Also, the analysis of results indicates that 47.5% of ships took evasive maneuvers in crossing scenarios.
Another geometric indicator approach is the safe boundary. This is based on areal boundaries that reflect spatial relationships between potentially colliding ships. Among these, collision diameter and ship domain are the most relevant concepts used in the field. Fujii and Tanaka (1971) defined the ship domain as “a two-dimensional area surrounding a ship which other ships must avoid — it may be considered as the area of evasion” (Fig. 4b). Analogously to the synthetic indicators, the one of safe boundary is a well-established approach in the practices of ship collision risk analysis (Montewka et al., 2010, Qu et al., 2011, Montewka et al., 2012, Goerlandt and Kujala, 2014, Baldauf et al., 2015), as it offers a concise and fast procedure to identify collision scenarios. However, it is known to be very sensitive to parameter settings and can provide significantly different outcomes for the same encounter case. Moreover, in the concept of safe domain, the perimeter of the safety area is a crisp boundary, sharply separating safety and risk conditions. In reality, boundaries of the safe area are uncertain due to the behavioural conduct of navigators.
To overcome this limitation, Zhang and Meng (2019) developed a model based on a probabilistic safe domain, i.e. the safe domain boundary is computed as a probabilistic value based on the distribution of the target ships. One-week AIS and ship characteristics were used as input data. A Gaussian kernel is employed to estimate the probability of the boundary of the domain. The authors compared this domain with the traditional ones: Fujii’s domain (Fujii and Tanaka, 1971), Goodwin’s domain (Goodwin, 1975) and an empirical domain based on AIS data (Hansen et al., 2013). Results show that the boundaries of the probabilistic domain is generally more conservative, including the Fujii and Goodwin’s domains.
Another study based on safe boundary approach was conducted by Yoo and Lee (2019), which introduced a Collision RIsk model (CoRI) based on the vessel traffic service operators’ and navigator’s awareness of ships encounter conditions. They compared this model with the one used by Korea Maritime Safety Audit based on Environmental Stress (ES). ES is a model based on judgements of the navigator about the risk level and it does not take into account ships encounter conditions. Indeed, ES tends to overestimate the risk. In order to improve the model, the authors introduced a CoRi model which evaluates the risk by considering the distance from the ship domains and the CPA, the time for avoidance maneuvers and the potential encounter of ships at CPA. Using one-year of AIS and RADAR data of the port of Busan (South Korea), the authors compared those models for three collision scenarios: crossing, head-on and overtaking. In contrast with CoRI, the ES model does not consider ship velocity in the assessment. Results showed that the ES model tends to highly overestimate risk with respect to the CoRI model.
Zheng et al. (2020) proposed a probabilistic approach, in which the ship domain is considered as a point cluster and used as input in a Support Vector Machine(SVM). SVM is a deep learning algorithm that carries out risk minimization by maximizing the margin between two clusters. SVM accomplishes the task by constructing an optimal hyperplane that better separates data clusters. In contrast with the conventional methods based on ship domains, SVM can estimate a quantitative and continuous probability of the risk by taking into account the states of ships, their relative position and their velocity. The points of the boundary of domains are used as input data to train the SVM. Three ship collision scenarios were carried out: head-on, crossing and overtaking. Results showed that head-on scenario is the most critical one and the overtaking scenario is the safest one. They compared these results to the results derived from traditional methods such as DCPA, TCPA and Spatial Collision Risk (SCR) model, showing that SCR does not take into account the overlapping of ship domains, and it underestimates the probability of collision in all scenarios.
More recently, Liu et al. (2022) proposed a novel approach based on ship domain able to quantify the collision probability and to define the consequences. They introduced two additional parameters: the maximum interval and the violation degree of two ship domains. The first parameter is used to evaluate the collision risk of two ships and it is usually based on geometric equations, however it is not suitable for ship domains composed of irregular curves. To overcome this limit, in this study, the authors applied SVM to obtain the maximum interval of two ships. The violation degree is the ratio of the intersection area between two ship domains to the sum of their individual areas. Head-on, crossing and overtaking scenarios were carried out. Analogously to the results found by Zheng et al. (2020), this study showed that the maximum collision probability is obtained during the head-on scenario and the safest scenario is the overtaking one.
6.2. Artificial neural networks
Artificial Neural Networks (ANNs) are mathematical models characterized by structures and calibration processes that can map complex relationships between variables by reproducing the human neural network (Abiodun et al., 2018). ANNs are widely used in many research areas thanks to their suitability to parallel computing and the possibility to store information on the network. They are widely used in the forecasting of events. For instance, ANNs are applied to forecast sea states (Duan et al., 2020, Fan et al., 2020b, Ma et al., 2021) and storm surge (Kim et al., 2019, Qiao and Myers, 2022). However, in contrast with other machine learning models such as SVM, they are usually described as “black boxes”, i.e. they capture the hidden relationships between inputs and outputs with a highly accurate approximation, however why or how they find a solution it is unknown (Foresee and Hagan, 1997).
Different types of ANNs were developed since their invention. Convolutional Neural Network (CNN) is composed by convolutional, pooling and fully-connected layers (O’shea and Nash, 2015). Each layer is comprised of neurons organized into three dimensions, the spatial dimensionality of the input (height and width) and the depth. The depth refers to the third dimension of an activation volume and it is defined by the number of filters contained in the convolutional layer, which aim is to detect features of data. The aim of the pooling layer is to reduce the complexity and the dimensionality of the model. Lastly, fully-connected layers contain neurons that are connected to the ones of convolutional and pooling layers, which aim is to perform the same duties of a standard ANN.
The application of ANNs in maritime risk assessment is not recent (Lisowski et al., 2000, Simsir and Ertugrul, 2009, Simsir et al., 2014, You and Rhee, 2016). However, up to now the ANNs have been used only for forecasting the future position of the ships, in order to avoid the collision, and not for the evaluation of risk indices. In this sense, a development of ANNs in collision risk assessment was done by Feng (2019), which built a CNN based on AIS data and experts’ judgements to assess the multi-ship collision risk in the Baltic Sea. In particular, firstly they calculated the initial regional vessel collision risk analyzing the risk factors by taking into account the characteristics of ships and their distance, then the experts revised those values, and the revised data and traffic images were used as input data of the CNN. They used 90% of input data for the training phase and the 10% for the testing phase. They also used a -means algorithm (Likas et al., 2003) to divide the test samples into seven clusters. The -means is a clustering algorithm that divides the dataset into pre-defined clusters where each data can belong to only one group. For each cluster the collision risk was calculated, and the mean absolute error was computed to validate the model. In particular, the model demonstrated an excellent performance between the real collision risk and the model results. The authors established different depths of the CNN to test its effectiveness and they found that the mean absolute error decreases as the CNN depth increases.
Similarly to Feng (2019) and Zhang et al. (2020) adopted a CNN to classify ship collision risk levels (Fig. 5). Specifically, the application of CNN allows to mimic experts’ judgements of actually risk levels. The authors converted three-month AIS data of the Baltic Sea area into traffic images and built two model of CNN: in the first one they used only the traffic images as input data and in the second one they used both traffic images and ship navigational information as inputs. Analogously to Feng (2019), for the training phase, 90% of data were used whereas the remaining 10% was employed for the validation phase. The aim of this study was to build a model able to classify multi-ship encounter situations by assigning risk levels by assessing the risk. The analysis of the performance of the CNN shows that when the depth of the CNNs increases the predictive accuracy of the model increases as well. However, analogously to overfitting, the excess of filters and, consequently, the increase of the depth, determines a decrease of the performance of the network. The second model that uses traffic images and navigational information is used to improve the predictive performance of the model.
Another type of ANN is the Recurrent Neural Network (RNN). The RNN can send information over time steps and the cyclic connections between its layers can enhance training in the temporal domain and exploitation of the sequential nature of the input. RNN generates outputs where the predictions at each time step are based on current input and information from the previous time steps (Kumaraswamy, 2021). However, ANNs required large memory space and high learning time. With the aim of overcoming these limitations, Xie et al. (2020) combined an asynchronous advantage actor–critic (A3C) algorithm, a Long Short-Term Memory (LSTM) neural network and Q-learning to evaluate multi-ship collision risk. LSTM is a particular type of RNN. In this network the neurons have different gates that can memorize or forget information (Van Houdt et al., 2020). When the value of the forget gate is equal to 1, the information are accepted; meanwhile, a value of 0 means it rejects all the information. Q-learning and A3C are reinforcement learning algorithms, both based on Markovian domains (Pinsky and Karlin, 2011). A Markov process is a stochastic process in which the probability of a known process that is transitioning to a next state depends only on the current state and its past behavior does not alter this probability. In particular, the Q-learning learns only from actions and experienced rewards (Azoulay et al., 2021); whereas the A3C algorithm works with multiple learning agents, which work in parallel with different cases within their respective environments (Mnih et al., 2016). Xie et al. (2020) proposed this combined model in order to improve the standard learning methods that have low learning efficiency issue in terms of computational time and memory costs. The authors compared the combined model with the original A3C method, simulating the encounter of four ships. The analysis of the results reported that the composite model has better performance than the original A3C in terms of speed and optimization. Specifically, in the composite model, after 200 epochs the collision avoidancetrajectories are more stable in terms of mean sum rewards. An epoch means training the neural network with all the training data for one cycle.
 Fig. 5. Convolutional Neural Network collision risk model layout (after Zhang et al. (2020)).
6.3. Bayesian networks
Another machine learning method that is widely used is the Bayesian Networks (BNs) approach. BNs are graphical inference models which provide a straightforward way to apply Bayes Theorem to complex problems, that can be used for a wide range of tasks in diagnostics and anomaly detection. They are formed by directed acyclic graphs, called nodes, that represent the random variables, and directed arcs, which represent casual or influential relationships between the variables. If a directed arc links a variable A to a variable B, then A is called parent node and B is called child node which means that A causes B. For each node in the graph, a set of conditional probability distributions is associated, that means that the distribution of a variable is defined for every possible outcome of the preceding nodes.
Thanks to their openness and flexibility in incorporating multiple sources of information (e.g. expert knowledge, stochastic simulation results, historical data), they are effective to model multi-state and non-linear causation relationships between accident contributing factors. On that note, their application in maritime risk field is not new (Hänninen and Kujala, 2012, Martins and Maturana, 2013, Montewka et al., 2014, Goerlandt and Montewka, 2015a, Sotiralis et al., 2016). However, the complex dependency relationships between contributing factors may create issues during the construction of the BN, especially if data are scarce. Indeed, when the number of probability parameters increases, the model complexity increases as well (Hänninen, 2014).
A step forward in this sense was done by Jiang et al. (2020), which proposed a ship collision risk analysis method based on a BN built with a K2 algorithm. K2 is a score-based algorithm which considers an ordering of variables as input and assume a random order of variables (Behjati and Beigy, 2020). The application of K2 algorithm avoids the ambiguous relationships that may occur during the construction of the BN. They collected historical accident data along the main route of the Maritime Silk Road (e.g. accident type, ship type, ship age) that occurred from 2017 to 2020 from IMO database and natural environment data (e.g. wind speed, visibility, fog) from Remote Sensing Systems. The authors used the expectation–maximization algorithm to learn the parameters, which find the maximum likelihood parameters and its aim is to estimate the missing data of a dataset by using the available observed data (Do and Batzoglou, 2008). The authors identified the influencing factors of maritime accidents and conducted a sensitivity analysis, to measure the mutual dependence between two variables and how much information can be obtained from a variable by observing the other one (Cover and Thomas, 2005). Also, three-scenario simulation were carried out. The first one assumed different accident types such as collision or contact. Results showed that collision accidents are the most significant one. The second scenario is placed in various locations (ports, sea, waterway). In the last one, several types of ships are considered and they found that tankers and bulk carriers are exposed to higher risk than passenger or container ship.
A few applications of BN use only quantitative information, without integrating e.g. experts/non-experts’ judgements. For instance, Fan et al. (2020a) proposed a BN based on a tree structure (called Tree Augmented Network), in which a parent node is connected to all child nodes and each child node can have another child node as parent (Wang and Webb, 2002). In particular, they used a data-driven method to build the model in order to involve less subjective causal relationships. The authors used the BN to investigate how human factors influence maritime accidents. They used the 2012–2017 accident reports from Marine Accident Investigation Branch (MAIB) and Transportation Safety Board of Canada to build the BN. The aim of the network was to find the relationships between risk influencing factors (RIFs) and the data. 25 RIFs were found as variables and a sensitivity analysis is conducted with different approaches: mutual information, joint probability and true risk influence to explain how much strong the relationship between RIFs and the typology of accident is. Finally, the authors simulated the past maritime accidents to validate the BN.
6.4. Multiple-criteria decision analysis
Multi-Criteria Decision Analysis (MCDA) is employed in highly complex decision-making contexts. It is a comparison procedure that aims to find the best solution among different options based on multiple, often conflicting, criteria. In other words, the MCDA tries to rationalize the process of choice by optimizing a set of multiple criteria, weighted according to some priorities. With this analysis, all the information, consequences and the perspectives linked to a possible choice that satisfies the criteria are highlighted.
Thanks to its advantages (e.g. adaptability to slight changes of the input data, ability to take into account uncertainty), MCDA is used in various research fields, including ship collision risk assessment (Arslan and Turan, 2009, Zaman et al., 2012, Wang et al., 2013, Karahalios, 2014, Sahin and Senol, 2015). However, criteria may generate conflicts with each other due to the different experts’ opinions that surface different alternatives and criteria. Also, these methods are not easy to compute when many variables are considered.
Some of the most used techniques are Analytical Hierarchy Process (AHP) and Elimination Et Choix Traduisant la REalité (ELECTRE) methods. AHP is a multi-criteria decision-making developed at the end of the 70s. Through pair comparisons, it generates priorities for the alternatives and for the criteria used in the judgement of the alternatives. Also, it summarizes the judgements of the criteria and of the alternatives in order to obtain a global judgement that represents a rational decision able to best achieve the large number of objectives of the decision-maker (Khaira and Dwivedi, 2018).
An example of AHP applied in ship collision is the study of Wang et al. (2016), which proposed a method based on AHP and an ANN. They based their work on Simsir et al. (2014) study and, in order to improve the previous study, they added environment factors, such as the influence brought by the relative movement speed of two ships and the traveling weather, in the calculation of the prediction time. Then, a group of experts identified six factors that played an important role in maritime traffic: visibility, traffic density, weather, experience, draft and the length ratio. For each of them, the authors used the AHP method to calculate the weights of each factor. From this analysis, the authors found that the weights of visibility and experience are the higher. Moreover, the authors included an ANN using AIS data as input in order to predict the position of ships after calculating the predicting time through the proposed algorithm. The predicting time is related to an environment factor that consider the ships’ speed and direction, weather condition, length ratio. Then, the collision risk is evaluated using the synthetic indicator DCPA and for each value of collision risk, a risk level is associated. To validate the proposed algorithm, the authors compared it with a three-minute prediction algorithm and calculated the Mean Square Error. The low value of the Mean Square Error showed the accuracy of the proposed algorithm to predict the position of ships and to alarm the drivers well in advance.
The other most used technique is the ELECTRE (Benayoun et al., 1966) method, that is an outranking method based on concordance and non-discordance concepts. It is composed by two phases: aggregation and exploitation. In the first phase, the concepts of concordance and non-discordance are used to make pairwise comparisons of the alternatives and different outranking relations are built. Four preference situations concerning the pairwise comparison can be handled: indifference, strict preference, weak preference and incomparability (Figueira et al., 2013). In the first one, the alternatives are equivalents; strict preference situation means that one of the alternatives is favored over the others for clear and positive reasons; weak preference situation means that one of the alternatives is favored over the others, but the reasons are insufficient to deduce the strict preference or the indifference and incomparability means that the previous situations are not possible. In the exploitation phase, the outranking relations are exploited and the main problem in this phase is to find adequate ways to treat the intransitivity and incomparability of the alternatives. Each exploitation procedure is adapted to three problems: choosing, sorting and ranking and the family of ELECTRE methods provides different methods to solve these problems. For example, an ELECTRE Tri-nC method is used for sorting problems in which, for each pre-defined category, alternatives are assigned (Govindan and Jepsen, 2016).
An example of application of the ELECTRE Tri-nC to assess the ship collision risk is presented by Silveira et al. (2021), in which they considered only judgements’ experts. The application of ELECTRE Tri-nC allows to sort the risk in various risk categories and to consider the risk as a decision problem. The experts found the most relevant criteria of collision risk (e.g DCPA, TCPA, wind and sea conditions, visibility, daylight, ships dimensions, bow crossing) and for each of them, they gave a weight in order to rank the criteria. The encounter scenarios were assigned to three risk categories (High Risk, Medium Risk and Low Risk) using ELECTRE Tri-nC (Almeida-Dias et al., 2010) to validate the model. The validation phase was performed by a group of experts involved in the development of the model and by another group that did not develop the model. The analysis of the results reports that 28 of the 30 encounter scenarios were classified in the same risk category by both groups of the experts. For the two remaining scenarios, the group of experts assigned two possible categories where one of them coincided with the other group of experts. That has demonstrated the good accuracy of the model that can easy reflects the experts’ judgements.
Another MCDA method is the Evidential Reasoning (ER) approach, which is used within problems having both quantitative and qualitative nature under uncertainties (Xu and Yang, 2001). It consists of hierarchical evaluation model and synthetic rules of Dempster–Shafer evidence theory (Gros, 1997), which is related to the Bayesian probability theory. In particular, the decision problem is modeling by using a belief decision matrix, in which the decision makers preferences are included. Then, the various belief structures are transformed into unified belief structure defined by a set of evaluation grades for qualitative attributes and by numbers for quantitative attributes (Xu, 2012).
Yu et al. (2021) used a BN and an ER to develop a ship risk model. In order to improve the construction of the BN, the ER was applied. It is able to assigns weights to the input data and then, to reduce the size of them. Two-month AIS data were used to identify the ship trajectories off the Coast of Portugal and, also, one year of Port State Control inspection data and experts’ judgements were used as input data. Moreover, the relevant RIFs are identified to develop a dynamic risk model based on dynamic information such as ship position and speed. Then, two kind of risk models are studied in that paper: static and dynamic ones. The static risk model is based on ship characteristics. The overall risk model combined these risk inputs into a BN. The validation of the BN is studied with an ER approach. The results obtained with this approach were similar to the BN’s ones. In particular, off-route ships, ship type and ship are the most important RIFs.
A development of Yu et al. (2021)’s work was done the following year by the same authors. Yu et al. (2022) studied the ships collision risk in real-time using MCDA techniques. In particular, they combined different methods, such as AHP and ER, to implement a real-time multi-criteria risk evaluation approach that considers both the geometric indicators and the navigational environment. One-day AIS data off the Coast of Portugal were used to calculate indicators such as DCPA and TCPA in order to find the potential collision candidates. Then, different scenarios under different environmental conditions were developed and, considering the experts’ judgements, a range of rules and their thresholds are generated in order to define the assessment criteria. For each rule, the experts assigned a weight and the AHP method is used to validate the reliability of the judgements. Also, the authors used an ER to calculate the collision risk in three different encounter scenarios: crossing, head-on and overtaking. Results showed that the collision risk depends on ships’ static state and encounter situations, in particular the ship collision risk associated to the overtaking scenario was the highest one. To validate the proposed model, the authors compared it with a linear regression model and a fuzzy regression model. The analysis of the results showed a more consistency between the proposed model and the linear regression model than the fuzzy regression model. However, the linear model presents some limitations that the proposed model overcomes.
6.5. Fuzzy logic
Fuzzy logic is a heuristic approach that generalizes the standard logic, in which all statements are described by a binary code. Thus, fuzzy logic includes zero and one as extreme cases of truth and it considers the various intermediate degreed of truth. It is a technique for representing and manipulating uncertain information. Fuzzy logic is composed by a fuzzy rule base, fuzzification, fuzzy inference engine and a defuzzification interface. The rule base contains the set of rules and the IF–THEN conditions provided by the experts. In other words, the input data are fuzzified in the fuzzy inference layer by using as fuzzy rule base the IF–THEN scheme. Then, the fuzzification transforms the input values into fuzzy linguistic variables (Ma, 2020). Those are the fuzzy rules of a fuzzy logic. The inference engine determines the matching degree of the input with each rule, and it decides which rules can be fired. At the end, as suggest by the name, defuzzification is the opposite of the fuzzification which translates the linguistic values into a numerical value (Kayacan and Khanesar, 2016).
Fuzzy logic has been widely used in the past in the ship collision field (Hwang, 2002, Kao et al., 2007, Qu et al., 2011, Zaman et al., 2014, Bukhari et al., 2013). However, there is not a standard method to set the exacted fuzzy rules and that may create complications during the construction of the fuzzy logic (Işik, 1991).
In order to overcome this limit, Li et al. (2018) combined an adaptive fuzzy system with an ANN to calculate an indicator called the Collision Risk Index (CRI). The combination of two methods allows to perform complex logic operations and to realize self-learning of fuzzy systems. An adaptive fuzzy logic can modify the characteristics of fuzzy rules analogously to back-propagation neural networks (Cox, 1993). The back-propagation algorithm contains two phases: the forward and backward phases. In the forward phase, the output values and the local derivatives at various nodes are computed. In the backward phase, the products of these local values over all paths from the node to the output are accumulated (Aggarwal, 2018). The authors compared the results of an ANN with the results of the adaptive fuzzy neural network. DCPA and TCPA are used to calculate CRI and this was used as target. As input data they used: speed, heading, angle and distance of selected ships. Results showed that the prediction error of CRI of the ANN is 0.07, whereas the prediction error of the adaptive fuzzy neural network is 0.003. That means the prediction accuracy of the proposed model is higher than that of ANN.
Fuzzy logic can be also applied to assess risk in real-time. A fuzzy inference system was built for ship-bridge collision alert by Wu et al. (2019). A fuzzy inference system is a system that uses a fuzzy set theory to map inputs to outputs (Wang, 2001). The input data of the input layer were the distance from the bridge, heading of the ship, ship and wind speed, sea state, visibility and day-time/night-time. These data derived from AIS data and from domain knowledge. Fig. 6 shows the scheme of the fuzzy logic used by the authors, which is composed by an input layer, a fuzzy inference layer and an output layer. The fuzzy inference layer used the IF–THEN scheme and The collision risk is obtained after the defuzzification with center of gravity method. Also, the authors used a Min–Max method as fuzzy inference engine. Wu et al. (2019)applied the proposed model in a real scenario that occurred in Wuhan Yangtze River Bridge in 2018 and the risk of collision is calculated for various points of the ship’s trajectory.
From historical data it is possible to see that the ship safely passed the bridge. However, the results show that the value of collision risk near the bridge is 0.50. That means the probability of ship-bridge collision is very high due to the fact the maneuverings of the ship are not perfect.
 Fig. 6. Schematization of the fuzzy logic-based collision risk model (after Wu et al. (2019)).
Another application of the fuzzy inference system was done by Namgung et al. (2019), which combined it with an ANN to establish the ship CRI. Analogously to Li et al. (2018), the combination of two methods allows to self-learn the fuzzy systems by taking into account ship dynamic parameters, such as distance between ships or their velocity. They calculated the DCPA and TCPA to deduct CRI and they introduced an ANN to optimize the fuzzy inference system. The authors used AIS data of Mokpo sea area (South Korea) as input vectors (e.g. ship speed, distance, ship courses). The whole dataset was divided in three parts: 70% was selected for the training phase, 15% for the validation phase and 15% for the test phase. The models gave different results of CRI, however the ANN presented better performance. Indeed, the data fitting was good as average R values (0.90).
A fuzzy logic is also used in the Hu and Park (2020)’s work, which combined it with an AHP in order to consider “vulnerabilities”. With this term, the authors mean the probability that a marine accident can occur due to bad weather, strong tidal currents or operator fatigue. In particular, they calculated the DCPA and TCPA to use as input in a fuzzy logic. Also, six vulnerabilities are found by a team of experts and they calculated their values with the fuzzy logic. In addition, they applied AHP method to evaluate the integration of the vulnerabilities. The experts compared the importance of vulnerabilities (criteria), two at time, giving a number from 1 to 9 and an importance matrix of vulnerability factors is built. The analysis of results showed that when the traffic and environmental influences are not considered into the collision risk analysis, the predictive model fails to recognize the collision scenario. In particular, when a vulnerability increases, the probability of ship collision increases as well.
Similar results were found by Hu et al. (2020), which focused on fishing vessels collision risk using a Fuzzy C-means algorithm. The latter one is a clustering method which permits to data to belong to one or more clusters. In particular, using one-day-AIS data of Mokpo area (South Korea), firstly, the authors calculated the DCPA and TCPA in order to obtain the basic collision risk through a fuzzy logic; then, they used the dynamic information of AIS data to divide into clusters the ships. Also, the authors take into account the vulnerability (Hu and Park, 2020) considering the distance and the size of fishing area. Combining the basic collision risk and the vulnerability using a fuzzy logic, the collision risk is found.
More recently, Aydin et al. (2021) proposed a Fuzzy Bayesian Networks (FBN) to evaluate the ship collision risk. The fuzzy logic allows to treat the uncertainty and the vagueness of the BN. They applied the model in a real ship collision scenario that occurred on July 2017 at the English Channel. A heterogeneous group of experts evaluated the ship collision probability and weights are applied on their evaluations based on their professional qualifications, experiences and educational levels. The authors used a trapezoidal and triangular membership functions during the fuzzification and the center of area approach as defuzzification method. They found that the most important influent factors for the ship collisions were human error, management and organization errors. In addition, a FTA was built to validate the results obtained by FBN.