1. Introduction
Systems metabolic engineering drives the transformation of microorganisms into effective bio-factories that produce large amounts of target molecules for various industries such as food, biotechnology, and pharmaceuticals (Choi et al., 2019). The integration of -omics data with computational tools used in systems biology defines systems metabolic engineering. This systems-level metabolic engineering integration allows the creation of new metabolic pathways and products and the rewiring of regulatory circuits (Lee et al., 2011), which in turn aids in improving strain development.
Metabolomics plays a crucial role amongst the -omics technologies. As the metabolome is downstream of the proteome, it is the endpoint of biological processes, hence, reflecting cell responses and phenotypical interplays from genetic and environmental perturbations (Griffin, 2006). Furthermore, metabolites also maintain intercellular signalling, energy balance and other cellular functions (Rubakhin et al., 2011; Amantonico et al., 2010). With improvements in the quality and coverage of metabolomics technologies, changes in metabolite levels due to complex biological interactions can be determined and can be integrated into models to determine the physiological state of a metabolic network (Töpfer et al., 2015; Volkova et al., 2020). Through systems-level metabolic engineering, with the focus on integrating metabolomics data with modelling approaches, the efficiency of microbial cell factories can be enhanced. Moreover, integrating metabolomics data together with fluxomics, transcriptomics, and proteomics into mathematical models seeks to promote rational approaches to improve strain and cell-line development (Roume et al., 2013; Vorreiter et al., 2016).
In this review, we focus on metabolomic approaches and the integration of modelling strategies. Insights on the progress and limitations of metabolomic data generation, dynamic and constraint-based modelling approaches will also be shared. Finally, the challenges faced and the potential of machine learning in systems metabolic engineering as a strategy to produce efficient bio-factories will be discussed.
2. Generation of metabolomics data
Metabolomics mainly involves the identification and quantitation of intracellular and extracellular small-molecule metabolites in a biological system. Metabolomics is important in acquiring an overview of a broad array of metabolites concurrently and can be executed in a high throughput manner (Hollywood et al., 2006; Wishart, 2007). Metabolites need to be extracted from cells, and prepared prior to instrumental analysis and data generation, to capture high fidelity time-dependent snapshots of metabolite profiles over the course of culture growth.
2.1. Sample preparation
A metabolomics workflow generally involves a few crucial steps, for instance, robust sample preparations with rapid quenching of metabolism, metabolite extraction, possible chemical derivatization, and instrumental analysis, processing of data with or without database information and additional statistical analysis and data interpretation.
Quick and efficient quenching protocols are essential for accurate quantitative snapshots of metabolic information as the metabolites are in a network that is continuously undergoing various biochemical reactions within a cell (da Luz et al., 2014). Microbial cells are usually quenched with solvent solutions at extreme pH or temperatures in attempt to rapidly arrest intracellular biochemical reactions (Doran et al., 2017). However, such solutions can damage the cell wall which confines the intracellular metabolites within the cell, causing the leakage of intracellular metabolites into the extracellular cell culture medium. These intracellular metabolites become diluted in the more voluminous extracellular medium, adding to significant variability in intracellular metabolite quantitation due to the presence of interfering extracellular metabolites and concentrated media components (Faijes et al., 2007). Fast filtration has also been used to separate microbial cells from cell culture medium prior to quenching through liquid nitrogen immersion or cold/hot solvent (Castaño-Cerezo et al., 2019; Wordofa et al., 2017; Kim et al., 2013; Jagtap et al., 2021). Even though this method overcomes the issue of intracellular metabolite leakage, the quenching of cell metabolism is not immediate due to the time required for the filtration process. Extracellular metabolites can be part of the initial cell culture medium composition and can be introduced through cell secretion, cell lyses or polymer degradation (Behrends et al., 2014). The turnover rates of extracellular metabolites are much lower than that intracellularly due to the lack of enzymes or the low concentrations of enzymes in the cell culture medium (Mo et al., 2009). Variability of extracellular metabolites usually results due to the presence of living microbial cells in the cell culture medium. Therefore, cells need to be removed quickly from the culture medium to prevent severe changes in the concentrations of extracellular metabolites and quenching solutions can also be employed to prevent metabolite degradation (Patejko et al., 2017; Pinu and Villas-Boas, 2017).
Intracellular metabolites are confined within a cell envelope or membrane, thus extraction of metabolites from the intracellular compartment usually involves the use of extraction solvents (Kim et al., 2013), acids (Zhong et al., 2018) or alkalis (Prasannan et al., 2018). Biological metabolites have extensively varied physicochemical properties, which makes it rather challenging for quick, complete, and non-biased sampling of metabolites from biological systems and their subsequent analysis (Pinu et al., 2017). For instance, methanol extraction is better for the recovery of polar and mid-polar metabolites, as compared to non-polar metabolites (Villas-Bôas et al., 2005a). Thus, either a few different protocols for metabolite sampling have to be employed concurrently or one comprehensive set of processes is utilized.
Solid phase extraction (SPE) and solid phase micro-extraction (SPME) are clean-up strategies, which can be used to reduce sample complexity prior to instrumental analysis. In a recent study, SPE was utilized to enrich 12 metabolites from the glycolysis and pentose phosphate pathways of yeast cells whilst facilitating the concurrent removal of abundant organic acids and sugars (Si-Hung et al., 2019). The matrix reduction aided metabolite quantitation during instrumental analysis. In another study, high throughput SPME followed by instrumental analysis was utilized to identify low-abundance and short-lived metabolites from bacterial cells (Mousavi et al., 2019).
2.2. Mass spectrometry-based metabolomics
The coverage of metabolites can be improved with various analytical techniques. Coupling chromatography to mass spectrometry (MS) enables the identification and quantitation of metabolites through the reduction in sample complexity by enabling the separation of metabolites before MS detection, thus reducing matrix interferences that may occur during the ionization process. Untargeted and targeted metabolomics are two main approaches used to analyze metabolites. Untargeted metabolomics is hypothesis-generating and is executed to analyze all detectable metabolites in a sample (Schrimpe-Rutledge et al., 2016). Targeted metabolomics may involve the validation and absolute quantitation of a selected subset of metabolites, for instance metabolites in a specific pathway (Cai et al., 2015). Targeted metabolomics can also be utilized to complement an untargeted approach. In this section, different metabolomics platforms for generation of metabolomics data will be discussed.
In recent years, the coupling of liquid chromatography (LC) and MS has been increasingly popular due to its versatility, sensitivity, and reproducibility of chromatographic data and mass fragmentation patterns (Gika et al., 2014). These intra- and extracellular metabolites are more suited for liquid chromatographic separation, as most of them are polar and non-volatile (Gika et al., 2014). In a targeted analysis, the application of LC allows these metabolites to separate with specificity and accuracy in quantification. For untargeted analysis of most cellular metabolites, a comprehensive gradient separation (typically using 0.1% formic acid in water and acetonitrile) with a suitable reversed-phase column can be applied (Pyke et al., 2015). Metabolites that are more polar in nature can also be analyzed using typically a HILIC (hydrophilic interaction chromatography) column (Contrepois et al., 2015). Applying ultra-high performance liquid chromatography (UHPLC/UPLC) methods can achieve good chromatographic resolution of peaks detected by the MS at shorter retention times (Cajka and Fiehn, 2016). Furthermore, the usage of ion mobility and high resolution MS have also contributed to improving the identification of isomers, providing better insight into biological functions (Wu et al., 2020). Dynamic labelling of metabolites in yeast has been studied using 13C-tracing and LC-MS analysis (Czajka et al., 2020). However, LC-MS can be prone to interferences from the sample matrix resulting in ion suppression which affects reproducibility and accuracy when determining trace metabolites in complex biological samples (Antignac et al., 2005). Ion suppression could suggest the occurrence of less volatile substances that can alter droplet formation or droplet evaporation efficiency, which affects the amount of gaseous charged ion that reaches the detector (Annesley, 2003). Ion suppression can be minimized or corrected by applying clean-up strategies to biological samples, chromatographic re-optimization, modifications to reagents utilized, and suitable calibration approaches such as the use of external calibration using matrix-matched samples, standard addition, internal standards, and dilution (Furey et al., 2013).
Numerous metabolites have carboxyl, hydroxyl, and/or amino functional groups, which are all polar. Therefore, chemical derivatization of extracted metabolites is usually executed prior to gas chromatography (GC) analysis to increase their volatility (Pawliszyn, 2012). However, this additional derivatization step can result in analyte loss and/or artifact formation (Kanani et al., 2008). Central carbon metabolites and amino acids are easily analyzed using GC-MS. Organic acids, sugar phosphates and alcohols, are usually derivatized in pyridine methoxyamine solution followed by trimethylsilylation (Phan and Blank, 2020). However, metabolites that are non-volatile or thermally unstable cannot be analyzed by the GC and requires LC instead. Several groups have also used enzymatic cleavage to convert non-volatile phosphorylated isoprenoid metabolites to their isoprenoid alcohols prior to GC-MS analysis (Huang et al., 2011). However, this approach may not result in high conversion efficiencies for the metabolites, and this further complicates accurate quantitation. For the quantitative analysis of such non-volatile phosphorylated isoprenoid metabolites, LC approaches would be beneficial. Furthermore, unlike LC approaches, the typical ionization method used in GC-MS is electron ionization(EI), which is less susceptible to ionization suppression. The fragmentation from EI ionization is useful for the identification of untargeted metabolites and reduces the demand for tandem MS (Papadimitropoulos et al., 2018). However, this results in metabolite fragments containing phosphate groups or a limited carbon backbone, which causes a loss of isotope labelling information in experiments involving tracers (Chu et al., 2015). For experiments involving tracers, a softer ionization such as chemical ionization (CI) can be utilized instead. In a recent study, negative chemical ionization was utilized to acquire 13C-labelling information of sugar phosphates for 13C metabolic flux analysis(Okahashi et al., 2019).
Capillary Electrophoresis (CE) coupled with MS has also been used in metabolomics (Barbas et al., 2011; Zhang et al., 2017). CE relies on the electrophoretic mobility of molecules arising from its low nanoscale flow for achieving compound separations. Such a difference in molecular separation from CE enables a complementary profiling pattern as compared to LC and GC approaches. However, even though CE has the highest separation efficiency CE-MS is the least robust and sensitive (Zhang et al., 2017).
Ion chromatography (IC) has conventionally been utilized for the analysis of both organic and inorganic ions in liquid samples (Weiβ, 1987). Numerous groups have analyzed anionic metabolites such as carbohydrates, nucleotides, organic acids, and sugar phosphates from biological samples through IC coupled with MS (Petucci et al., 2016). IC-MS offers benefits over other profiling platforms with regards to its unique selectivity. The exceptional resolution of IC has enabled the distinction between numerous polar metabolites which are isobaric and isomeric. Furthermore, IC is adept in analyzing various glycolysis and the tricarboxylic acid cycle (TCA cycle) intermediates, which have a wide range of chemical properties. Capillary IC coupled to high resolution MS has also been used to detect low quantities of sugar phosphates, organic acids, and co-factors, in cell cultures (Hirayama et al., 2020).
Ion mobility MS is an electrophoretic technology based on gas phase, where ions are differentiated in the gas phase and electric field depending on their charge, size, mass, and shape (Ren et al., 2018). Ion mobility MS enables the distinction between isobaric and isomeric metabolites, and can determine the conformation of metabolites (Paglia and Astarita, 2017). LC coupled with ion mobility MS has been used to distinguish isobaric disaccharides in biological samples (Pičmanová et al., 2022). Even though ion mobility MS has high throughput capabilities, aids in the identification of metabolites, and improves metabolome coverage, there are issues with lower sensitivity and repeatability between instruments (Zhang et al., 2018a).
2.3. Nuclear magnetic resonance spectroscopy
Nuclear magnetic resonance (NMR) spectroscopy is another popular analytical technique applied in metabolomics. NMR spectroscopy has the advantages of being rapid, highly reproducible with a relatively simple and non-destructive sample preparation protocol, and also allows the analysis of complex mixtures without the need for separation (Murovec et al., 2018). NMR spectroscopy can uniquely characterize the chemical structure of a molecule by determining nuclear chemical shifts and their location inside a magnetic field, where the ratio of peak intensity and proton number is directly proportionate to concentration of the metabolite (Cascante and Marin, 2008). The qualitative and quantitative data generated is especially useful for the exploration of the complex interactions of biological networks in a metabolomics approach. However, compared to MS, NMR has a lower sensitivity with a detection limit of 1–5 μM and also possesses the problem of overlapping signals generated by different metabolites in the spectrum (Zhang and Powers, 2012). This is a problem for 1D NMR which can be overcome by 2D NMR which can better characterize the signals. Despite these drawbacks, the quality of NMR data can always be improved through the use of probes that are cryogenically cooled to 4.5 K, resulting in a four-fold increase in sensitivity and two-dimensional NMR measurements can also be performed (Lankadurai et al., 2013). Stable-isotope-guided NMR has demonstrated the transformation patterns of various metabolites from numerous biota (Uchimiya et al., 2017). MS and NMR are complementary techniques which have provided fundamentally distinct knowledge in metabolomics as demonstrated by several metabolomics studies (Jousse et al., 2017; Meyer et al., 2013; Nemadodzi et al., 2020). NMR has been also used to measure in vivo metabolites and fluxes (Bastawrous et al., 2018). Furthermore, more recently, NMR methods have been developed whereby the requirement for continuous metabolomics monitoring has been addressed. For instance, flow NMR has been used to study extracellular metabolites from organisms cultivated in liquid culture (Bastawrous et al., 2018).
2.4. Quantitative metabolomics
The quantitation of metabolites is challenging due to the various issues that arise during the quantitative workflow, which involves the quenching of metabolism and the extraction, identification, and quantitation of metabolites. The generation of such quantitative information from metabolic networks is important for model building. By understanding the underlying issues associated with quantitation in each step of the workflow, one can deploy strategies to eliminate or minimize quantitative pitfalls.
The aim of quenching and extraction is to create a metabolic extract which quantitatively reveals the metabolites present. During quenching, the metabolite levels could be perturbed in the harvesting process or there could be incomplete rapid termination of enzyme activity. As mentioned previously, fast filtration followed by rapid placement in quenching solvent is recommended. To compensate for analyte losses during extraction, standards should be added to the original extraction solvent. Furthermore, as metabolite extracts have numerous compounds that can degrade or interconvert (Siegel et al., 2014), the time interval between sample preparation and analysis should be reduced.
The concentration of metabolites from extracts can be determined by comparison to internal standards, where intensity differences between 15N or 13C labelled standards and unlabelled metabolites can be measured using MS while a reference metabolite is usually used for measurements on NMR. Metabolite concentration can also be determined by external comparison to metabolite standards of a concentration range. As matrix effects can interfere with quantitation, external calibration curves are usually made through the addition of standards into the extracted biological samples. Although isotopically labelled internal standards are frequently used for quantitative metabolomics, they are commercially unavailable for several metabolites. To overcome this, microbial cells can be fed with a labelled nutrient such as 13C-glucose and the labelled metabolites can be used as internal standards (Castaño-Cerezo et al., 2019). However, correction for incomplete metabolite labelling is vital for proper quantitation (Bennett et al., 2008).
There are various issues with the quantitation of metabolites using LC-MS. To transform LC-MS data into metabolite abundances, peaks must be matched to metabolites, where there is a reliance on retention time and mass. Although there is specificity from both the retention time and mass, peak mis-annotation persists as a key issue. Peak mis-annotation could arise due to isomers, interferences of similar molecular weight, and in-source degradation products. LC and tandem MS can be utilized to separate isomeric metabolites (Koley et al., 2022), and if this is insufficient for isomer separation, chemical derivatization can be used instead followed by analysis either on the LC or GC (Struys et al., 2004; Gibson et al., 1993). In the case of interferences between analytes of similar molecular weight, the use of high-resolution MS can aid in reducing such interferences. In-source fragmentation decreases the signal of the metabolite ion and results in fragments that have the same molecular formula as the molecular ion of another metabolite (Purwaha et al., 2014). The development of ion sources which reduce in-source fragmentation could overcome this problem (Lu et al., 2016). Metabolite extracts from different groups of samples should be run in a randomized manner for quantitation in LC-MS as the absolute signal intensity can drift due to factors such as alterations in ionization efficiency. Another important issue that affects metabolite quantitation in LC-MS is ion suppression. The occurrence of ion suppression and mitigation measures have been discussed in the previous section.
For quantitation using the GC-MS, an area of concern is the loss of derivatized trimethylsilyl groups. The GC-MS is robust for the quantitation of phosphates, hydroxy acids, and sugars as O-trimethylsilyl groups are stable. However, as N-trimethylsilyl groups are less stable, during the analysis of trimethylsilylated amino acids and amines, there could be varying ratios of partially and fully derivatized metabolites across samples. To improve the precision and accuracy in the quantitation of metabolites, a few derivatizations can be executed, resulting in more than one analytical run. For instance, trimethylsilylation can be used for the quantitation of sugars, hydroxy acids, and phosphates, while tertiary butyldimethylsilylation can be used for amino acids and amines (Niehaus et al., 2014).
For metabolite quantitation using NMR, calibration of signals from experimental data should be executed by using standard mixtures prepared at known concentrations. Quantitative errors in NMR could arise due to problems in resolving individual peaks, whereby peak fitting and multi-dimensional NMR may be used to improve measurement precision (Mauve et al., 2016). NMR is useful for the quantitation of flux through metabolic networks due to its ability in determining position-specific isotope labelling in metabolites (Reardon et al., 2016). However, there is a major issue with using such isotope-based analyses for quantitation, as the 1H–13C signal is artificially deflated due to signals from 1H–13C relaxing more rapidly than those from 1H–12C (Lewis et al., 2010). Although, this quantitative pitfall can be corrected with isotopomer standards, such standards required for this calibration are often costly or unavailable.
GC-MS and LC-MS are complementary techniques, which can be utilized for the quantitation of different metabolites. In this section, various quantitative pitfalls and mitigation measures have been highlighted to improve the quantitation of metabolites using such analytical techniques. Executing in vivo measurements using NMR could potentially alleviate the numerous ways in which metabolite concentrations can be modified during quenching and extraction.
2.5. Dynamic metabolomics
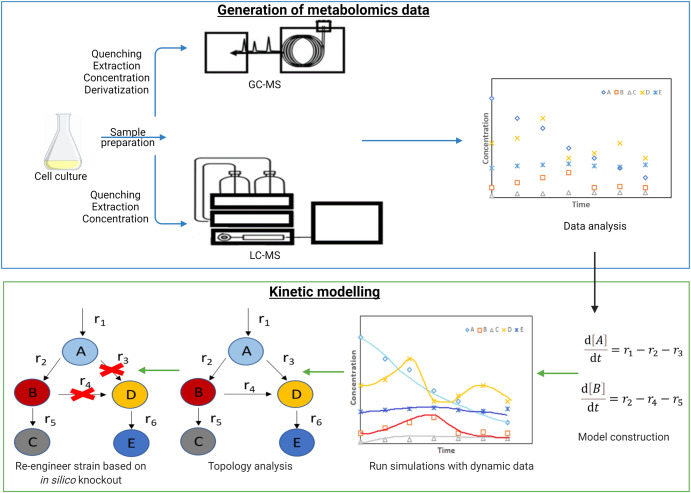
Dynamic metabolomics involves the generation of time-series data from intracellular and extracellular metabolites. Appropriate methodologies (as discussed in the previous few sections) are required to quench metabolism, extract, and quantify intracellular and extracellular metabolites (Villas-Bôas et al., 2005b), at various time-points to generate dynamic data (Fig. 1). In previous studies, time-series data has been generated from bacteria (Chassagnole et al., 2002) and yeast (Rizzi et al., 1997; Theobald et al., 1997; Sasidharan et al., 2012). This in vivo dynamic data enables the determination of enzyme kinetics and creation of kinetic or dynamic models which help to explain metabolite dynamics (Chassagnole et al., 2002; Rizzi et al., 1997; Nikerel et al., 2006; Link et al., 2014).
 Fig. 1. Workflow of generating dynamic time-series data of metabolites followed by kinetic modelling of the network. The metabolic network topology is adjusted to fit the time-series metabolic data of metabolites A, B, C, D and E. In silico knockouts to increase the yield of desired metabolite C, for instance, can guide metabolic re-engineering of the microbial strain.
To gain information about the changes in the metabolic state of microbial cells through dynamic time-series data is experimentally demanding. Therefore, research studies need to consider the duration of the measurements, number of experimental replicates and the time resolution in generating such data. There are also issues with extraction biases in metabolomics experiments (Sitnikov et al., 2016) as well as analytical and biological variances (Tabatabaei Anaraki et al., 2018). Furthermore, due to the need for rapid extraction of intracellular metabolites from microbial cells, large-scale real time monitoring of metabolite abundance is lacking. Improvements in high throughput metabolomics and real-time metabolomics, which will be discussed in the next two sections, will aid in data generation that can further enhance our understanding of metabolic networks in microbial cells.
2.6. High throughput metabolomics
Robotics can be applied to increase coverage in high throughput applications of strain selection through the automation of sample preparation and metabolite extraction (Yizhak et al., 2010; Vavricka et al., 2020). The use of liquid handling technologies also allows for good reproducibility of samples extracted and is therefore vital for high throughput sample preparation (Liu et al., 2019a). Cultivation devices such as microtiter plates or micro-bioreactors have also been integrated to robotic cultivation platforms, enabling growth parameters for cell cultures to be fully automated and controlled (Long et al., 2014; Faust et al., 2014; Unthan et al., 2015; Heux et al., 2014; Bergès et al., 2021).
Microfluidic platforms allow for enhanced analysis speed, diminished sample volumes, and improved multiplexing capabilities (Wang et al., 2015). Microfluidic platforms can mix small volumes of reagents and solutions through integrated channels and reaction chambers. This makes such devices suitable for studying the growth of cells. Many microfluidic applications for cell culture, including isolation, lysing, concentration, cell sorting, single cell analysis, and metabolite monitoring have been reported (Huang et al., 2008).
Electrochemical microsensors or LC-MS can be used to monitor metabolites from lab on chip devices. Various miniaturized separation techniques such as microchip-LC, microchip-CE, and micro-SPE have also been used together with MS (Gao et al., 2013; Ohla and Belder, 2012). Fluorescence and electrochemical detection are frequently used with micro-chip CE for metabolite analysis (Huang et al., 2008; García-Pérez et al., 2008; Kraly et al., 2009), for instance, adenosine triphosphate in bacterial cells were lysed on a microchip-CE device prior to quantitation using bioluminescent detection (Liu et al., 2005). However, such devices are only useful in the detection of electroactive species and therefore limiting their potential for multiplexing, and the electrodes used in the fluidic system eventually degrade with time. Although LC-MS allows for the detection of many metabolites, aliquots need to be removed from the chip prior to analysis. As NMR spectroscopy is non-invasive, it is particularly suitable for the metabolomics observation of live systems, where quantitation of metabolites can be executed directly (Cox et al., 2019). Sensitivity becomes an issue though, due to the small sample volumes used in microfluidic systems. Microfluidics and micro-NMR have been combined to quantitatively investigate metabolism of cells in a single spheroid (Patra et al., 2021; Kalfe et al., 2015). An innovative platform utilizing microfluidics with LC-MS-NMR was also used for targeted and untargeted analysis of metabolites from a bacterial extract (Lin et al., 2008). The nanoSplitter enabled MS analysis, while the HPLC effluent was concentrated by microdroplet NMR, allowing for greater sample throughput efficiency than the traditional flow-injection methods.
Single cells can be individually analyzed through compartmentalization, allowing for the analysis of cell heterogeneity when culture conditions are altered. Isolation of single cells in microfluidics can be executed through cell confinement within microfluidic structures such as droplets, nano-liter wells and channels (Prakadan et al., 2017). Droplet microfluidics is one such platform that allows for the compartmentalization of single cells in cell culture. Typically for droplet microfluidics, pico-liter monodisperse aqueous droplets are created in an oil phase on a microfluidic device (Curran, 1998). In a recent study, metabolites from yeast were determined from microfluidic droplets using HPLC, where different incubation formats were found to affect cell metabolism (Bjork et al., 2015). The control of culture conditions is important for the screening of single cells in droplets, as the production yields from cell factories are affected by the metabolic state of the cells. In another study, a microfluidic platform was developed to determine the consumption and secretion of metabolites, where a microfluidic droplet maker was utilized to trap yeast and bacterial cells and growth medium, enabling the identification of strains with the ability to overproduce or overconsume metabolites (Wang et al., 2014). This high-throughput approach could be utilized to identify mutations accountable for phenotypes which are technologically vital. There are some limitations with droplet microfluidics as assays used, such as enzymatic fluorescence, need to be compatible with the platform and metabolites can only be water soluble and immiscible in the oil phase for successful encapsulation (Wang et al., 2014). Furthermore, the number of metabolites that can be profiled using such single-cell platforms need to be increased, with sensitivity being the main bottleneck. Studying the metabolome of single individual cells is rather difficult due to the low quantities and large diversity of metabolites of the cellular metabolome and it is challenging to interface such samples with the MS (Zenobi, 2013). The handling of samples in single cell analysis requires a precise platform as minute losses in the usual cell population methods may result in large variations amongst individual cells (Liu et al., 2019b). Many individual cells are also required to be profiled concurrently to enhance the quality of data (Prakadan et al., 2017). Furthermore, the media of cell cultures contain various components which could result in matrix effect especially at the single cell level, requiring the further removal of matrix interference (Zhang et al., 2016).
Thus far, high-throughput metabolomics from cell cultures has not seen the coupling of microfluidic separation techniques with MS. There could be potential for high-throughput metabolomics based on previous work which shows the possibility of parallel sample preparations (Huft et al., 2013). Coupling of microfluidics to MS will aid in the development of high-throughput analysis systems. Electrospray ionization (ESI) is frequently used for on-line microfluidic analysis due to its compatibility with low flow rates, while matrix assisted laser desorption/ionization (MALDI) has been used with microfluidic devices due to the possibility of automation and high-throughput sample preparation (Wang et al., 2015; Ibáñez Alfredo et al., 2013). Improvements in single cell microfluidics can also aid in understanding cell heterogeneity in cell cultures, as product yields from bio-factories are affected by the metabolic state of the cell and cells from mutant strains can be screened in a high-throughput manner to identify phenotypes which are important for enhanced product formation. Furthermore, large sample sizes can provide important insights into the dynamics of biological systems (Cannon et al., 2018; Sengupta et al., 2016). With advancements in microfluidics-MS, perhaps there would be improvements in throughput and sensitivity allowing for better metabolite coverage.
Another important consideration in the application of high-throughput metabolomics using microfluidics is the hydrodynamic, mass and heat transfer contexts that such apparatus operate under (Chhatre et al., 2011). Such environmental conditions directly impact the growth and viability of cells, and thus their metabolism. Cells in microfluidic devices are categorically growing in environments different from typical scales in laboratory flasks and bioreactors. Larger cultures at pilot (102-103 L) and commercial scales (103-105 L) are even more disparate in comparison (Flickinger, 2010; McConville and Kessler, 2010; Vivek et al., 2022). The metabolomics profiles and culture information acquired via microfluidics experimentation have to be understood within its respective environmental multi-physics considerations.
2.7. Real-time metabolomics
Real-time metabolomics allows for the simultaneous and high throughput analysis of metabolites from microbes without the need for sample preparation (Link et al., 2015). Real-time metabolome profiling has been executed in live bacteria and yeast through the direct injection of liquid cultures of single cells into a high-resolution MS which allowed for the automated monitoring of metabolites (Link et al., 2015). Through real-time profiling of metabolites, data modelling, and inhibitor experiments, the authors found switch-like feedback inhibition between starvation and growth in bacterial cells. In another study, live microbial colonies growing on agar were directly sampled through a surface sampling probe for ESI-MS which resulted in the immediate extraction and ionization of metabolites without the need for sample pre-treatment (Hsu et al., 2013). A microfluidic-based extraction system coupled to MS was also used for the continuous real-time analysis of metabolites from Escherichia coli, where cyclic patterns and metabolic trajectories could be predicted through the study of bacterial growth and stress (Heinemann et al., 2014). As the bacterial cells displayed predictable changes during stages of growth and stress, the authors suggested that future phenotypes could be implied through these trajectories. This approach could be useful when studying viable strains to produce targeted compounds. In another recent study, NMR was used to monitor central carbon and amino acid metabolism in microbe cells in real-time (Judge et al., 2019).
Such studies driving the generation of high-resolution real-time metabolite time-series data provide the real-time quantitation of changes in intracellular metabolites. This in turn could enhance conventional metabolomics assays for the prediction of phenotypes due to experimentally derived metabolic models (Link et al., 2014).
2.8. Spatial metabolomics
Spatial metabolomics involves the detection and interpretation of metabolites in the spatial context of cells and organisms (Petras et al., 2017), where the localization of metabolites is mainly determined through imaging MS (Doerr, 2018; Buchberger et al., 2018; Bodzon-Kulakowska and Suder, 2016). In conventional metabolomics, for instance, the localization of metabolites within specific organelles is not known as extracted metabolites (intracellular and extracellular) are subjected to quantitation usually through the MS (Patti et al., 2012; Lu et al., 2017). Imaging MS allows for the mapping of MS data to two dimensions showing the chemical makeup of microbes (Watrous and Dorrestein, 2011) and can profile cells in situ, enabling the link of molecular information such as cell-cell interactions with spatial information. Sampling is executed systematically through the division of a sample into a grid of pixels (Alexandrov, 2020). Metabolites are then desorbed from every pixel in the grid through a laser, subsequently, a mass spectrum is produced displaying relative molecular intensities within the pixel (Fig. 2), imaging MS results in large datasets, with 10,000 to 1,000,000 spectra each relating to their own pixel (Nguyen et al., 2021). There are also other approaches in spatial metabolomics such as spectroscopy (Movasaghi et al., 2008; Langer et al., 2020) and molecular cartography (Protsyuk et al., 2018). As discussed in the previous section, MS is the most common technique for metabolomics (Alseekh et al., 2021) since it offers good sensitivity, specificity, and molecular coverage. This makes imaging MS the most preferred method for spatial metabolomics.
 Fig. 2. Imaging MS to determine spatial localization of metabolites from a sample. In imaging MS, molecules are ionized from a sample spot, generating a mass spectrum. Image construction occurs through the mapping of intensities acquired from specific mass peaks at each spot across the sample.
Metabolic imaging techniques can probe microbial metabolism allowing for better insight at the resolution of sub-cellular, single-cell and population level. Furthermore, there is also the possibility to determine changes in microbial metabolism in various host environments, and better understand dynamics and regulatory mechanisms of cell metabolism (Aldridge and Rhee, 2014). Regulation and cellular metabolism may be linked through high throughput imaging together with sensing techniques (Bellin et al., 2014). Traditional fluorescent imaging has also shown links between metabolism and the physiological state of bacteria (Parry et al., 2014). Metabolites or the general redox state of some metabolic processes are usually determined from metabolic imaging techniques. Such methods allow for time-lapse and measurements at single cell level while imaging MS sacrifices time-lapse and resolution at single cell level to determine metabolites at the systems level (Aldridge and Rhee, 2014). For instance, the multidimensional metabolic state of bacteria has been determined at single-cell and sub-cellular level using dynamic secondary ion mass spectrometry (SIMS) imaging MS (Watrous and Dorrestein, 2011), while MALDI-TOF (matrix assisted laser desorption/ionization-time of flight) and nano-DESI (desorption electrospray ionization) imaging MS have been utilized to study metabolites produced within microbial communities and the interactions between such communities (Traxler et al., 2013; Yang et al., 2009).
Many metabolites are structurally similar and related spatially as they are involved in similar metabolic networks. In a recent study, such chemical relations in networks were studied using MALDI imaging MS (Geier et al., 2020). Even though imaging MS provides insights to the spatial distribution of metabolites, to be fully convinced of the metabolite identification additional information such as tandem MS or molecular purification followed by structural elucidation with NMR would be beneficial (Nguyen et al., 2021). Imaging MS which is non-invasive can also be used to highlight cell heterogeneity over time. For instance, phenotypic heterogeneity was illustrated through the imaging of metabolite production, such as in clonal communities which were in the same microenvironment (Ackermann, 2015).
Even though spatial metabolomics using imaging MS allows for the localization of metabolites, it does suffer from some drawbacks compared to conventional metabolomics, where developments in the computational field could help to improve these gaps. Firstly, imaging mass spectra are highly complex as there is lack of analyte separation, such as separation through a chromatographic column, prior to MS analysis. This results in numerous peaks (which could potentially overlap) with background noise. The use of ion mobility spectrometry has the possibility to overcome this drawback as metabolites can be separated depending on their collisional cross section prior to imaging MS (Sans et al., 2018). Secondly, molecular identification possess a big challenge in spatial metabolomics involving imaging MS. For conventional metabolomics, tandem MS is often used, where analytes are fragmented and then measured in a mass spectrometer (Kim et al., 2018a). This MS/MS aids in the identification of molecules. Imaging MS does not use tandem MS, instead only mass-to-charge ratios are determined, with no fragmentation, which hampers molecular structure identification. Imaging MS is also currently unable to gather spatially resolved data-dependent tandem MS data. In imaging MS, the MS/MS spectra that can be gathered are only for a few selected ions for a few pixels (usually not using a true imaging mode) and are typically of poor quality due to the low quantity of metabolites present in one pixel (Alexandrov, 2020). Recently in attempts to improve metabolite identification from imaging MS data, an approach on metabolite to signal match score was used based on imaging MS data and theoretically derived properties of metabolites (Palmer et al., 2017; Alexandrov et al., 2019). Even though this approach outperformed mass-to-charge ratio matching, a large portion of imaging MS data was left unannotated as currently there is inadequate knowledge of signal formation of analytes and ionization pathways when using imaging MS.
Spatial single-cell metabolomics is an emerging area, where various imaging MS approaches have exhibited the capability to obtain data that can determine cell types and the related metabolic changes which occur with perturbations (Rappez et al., 2019; Gilmore et al., 2019; Do et al., 2017). Artificial intelligence and machine learning have been used in single-cell transcriptomics (Angerer et al., 2017; Hrovatin et al., 2022) and can potentially drive the analysis and interpretation of large spatial datasets obtained from single cells. As more insight is gained about metabolic networks in microbes, correlating metabolomics with spatial resolution through imaging MS and with single cell measurements through time will become increasingly important.
3. Modelling approaches
Constraint-based and dynamic-based modelling can be used to model the metabolomics data that has been generated experimentally. In doing so, researchers can gain distinct and complementary insights into intracellular metabolism (reactions) that is not obvious based on the concentrations of metabolites alone. Extracellular metabolite concentrations can be measured via analytical approaches (as discussed earlier) over various timepoints, and their rate of exchange with the modelled biological system can be evaluated as the change in their bioreactor concentration per unit time, further divided by the dry cell weight per unit bioreactor volume. The intracellular rate of substrate consumption and product formation (i.e., reaction) can be similarly evaluated. For constraint-based flux balance analysis of a stoichiometric metabolic model, the calculated rate of metabolite exchanges is used to constrain the model in deriving feasible flux solution. Whereas for kinetic modelling, the mathematical model for a reaction/exchange rate is fitted with both its assessed rate of reactions/exchanges as well as substrate concentrations to derive the model parameters. Fitted models are then simulated collectively to obtain the temporal profiles of metabolites, which can be further tested in a perturbed condition, for instance, using a deleted enzyme.
Constraint-based modelling can be used in larger biological networks at the genome scale, as it just involves information on the stoichiometry of reactions in the metabolic network and mass balances for the metabolites under pseudo steady-state assumption (Oberhardt et al., 2009). Alternatively, dynamic-based modelling involves biochemical reactions which are described by ordinary or partial differential equations (Tomar and De, 2013). The application of dynamic models is, however, restricted to well characterized biochemical systems as many intracellular metabolite measurements are required experimentally for this modelling framework. Machine learning can be potentially used to overcome some of the problems faced by conventional constraint-based and dynamic-based models, as discussed in the following section.
3.1. Constraint-based modelling
Metabolic models have been used for metabolic engineering to better comprehend complex metabolic networks. Even though dynamic models have been used (Saa and Nielsen, 2017), such models are more suitable for small-scale modelling. For large-scale modelling approaches, for instance genome-scale models, it is rather difficult to integrate kinetic modelling as obtaining reliable kinetics and large data sets measured through experiments is challenging (Kim et al., 2018a). Hence, constraint-based modelling approaches have been used instead for large-scale modelling. Genome-scale models have been developed to determine metabolic activities and thus identify targets for gene manipulation (Park et al., 2009; Orth et al., 2010; Thiele and Palsson, 2010). This approach is useful in understanding slow growth rates and low product yield, that occurs after using a rational engineering approach at the systems level. Such stoichiometric constraint-based models have been used to direct metabolic engineering without requiring mechanistic detail (Kim et al., 2017). These models enable flux determination through optimizing the maximum rate of cell growth or product formation using mass balance equations with stoichiometric metabolic reactions occurring under steady state assumptions (Lee et al., 2012).
Flux balance analysis (FBA) is commonly used in constraint-based modelling (Orth et al., 2010). Represented as a linear programming problem, the method maximises biomass production as a cellular objective, subject to flux capacity, stoichiometric, and thermodynamic constraints. There have been various variations to these FBA models. In steady state regulatory FBA, the model is linked to the regulation network at a transcriptional level (Shlomi et al., 2007). Transcriptional regulation has also been integrated in a probabilistic approach in a genome-scale model (Chandrasekaran and Price, 2010). In another approach, reaction thermodynamics have been considered (Henry et al., 2007), while genomics and flux-converging patterns have also been considered in FBA (Park et al., 2010). In another study flux balance analysis with an extra constraint of occupancy in the membrane was introduced (Zhuang et al., 2011).
Metabolic flux analysis (MFA) can be used to ascertain the internal flux distribution of the network by measuring uptake and secretion rates and isotopic labelling information in metabolites (Stephanopoulos et al., 1998). Frequently, 13C-MFA is used to determine in vivo metabolic fluxes (Antoniewicz, 2015). The most likely flux distribution in the network is determined from the difference between experimentally measured and the predicted isotopomer distributions amongst metabolites. Through the comparison of in silicosimulation with isotopologue data, one can report which of the predicted metabolic fluxes is true and the difference from in vivo metabolomic data. 13C-MFA can also be utilized as an inverse problem to determine fluxes which results in the best match of fluxes which were experimentally measured (Fondi and Liò, 2015). For instance, through 13C-MFA and in silico flux based analysis, the metabolism of xylose in yeast cells was studied, where futile pathways and the relation between xylose utilization and energy maintenance of cells were discovered (Feng and Zhao, 2013). Large scale 13C-MFA has also been executed in cyanobacteria (Hendry et al., 2019) and in another study, 13C-MFA was used in parallel labelling experiments with 13C-labelled glucose tracers in bacterial cultures (Long and Antoniewicz, 2019). A novel approach used 13C-MFA in bacterial co-cultures to establish simultaneous metabolic flux distributions in several species and to estimate metabolite exchanges between species (Gebreselassie and Antoniewicz, 2015). When comparing MFA and FBA, the metabolic network used in MFA only involves carbon transitions whilst flux balance analysis involves carbon and non-carbon internal and transport reactions. An extension of MFA to the genome-scale and the capability to establish in vivo intracellular distributions of non-carbon atoms will be rather intriguing (Ravikirthi et al., 2011).
While the assumption of metabolite steady state (i.e., intracellular concentration remains unchanged with time) in FBA is satisfied in continuous cell culture conditions and during the exponential growth phase of the batch culture, it does not hold true for the entire duration of the batch culture and in the bioreactor setups such as fed-batch condition. Given the computational intractability of kinetic modelling for genome-scale metabolic network, significant efforts have been devoted to extending the FBA approach for dynamic conditions by presuming and modelling steady-state metabolism sequentially in time. Such approaches include dynamic FBA (dFBA) (Mahadevan et al., 2002) and dynamic MFA (dMFA) (Leighty and Antoniewicz, 2011). Similarly to FBA, they evaluate the growth rate at each modelled time point under constraints (stoichiometric, metabolite exchanges, etc.), but innovatively use it to derive the exchange rates for the subsequent time point by integrating mass balance equations relating metabolite consumption and production (Yasemi and Jolicoeur, 2021). For simulation to proceed smoothly, the growth rate may be fitted to a continuously differentiable function, such as the Monod model. Discrete transcriptional regulatory effects have been initially introduced as additional flux constraints for specified reactions at respective time points (Covert et al., 2001). Subsequently, they have been more deeply integrated into the model by formulating the optimization problem nonlinearly (Mahadevan et al., 2002). While it has allowed for more dynamic regulatory information to be included, the increased computational complexity also resulted in poorer scalability with the size of the metabolic network. In addition, the inclusion of non-equilibrium thermodynamic constraints, such as those of enthalpy, entropy, free energy, and energy conservation, have improved flux predictions (Qian and Beard, 2005). Furthermore, combining dFBA with ODEs and Boolean logic (Covert et al., 2008) or via integration of extracellular cues (Min Lee et al., 2008) have resulted in similar or more accurate predictions, compared to kinetic models of the same size, while retaining their relative scalability. More recently, dFBA has been applied to predict batch and chemostat time courses in terms of the activity and composition of a microbiome, consisting of hundreds of microbial species, whose genome-scale models have access to a common metabolite pool (Popp and Centler, 2020). The method thus allows for the rationalization of meta-omics profiles and the compositional dynamics.
Genome-scale models have also been used to guide strain development. For instance, cubebol production in Saccharomyces cerevisiae was enhanced through the identification of gene deletion targets by minimizing metabolic adjustments (Asadollahi et al., 2009). This approach of using simulations to identify gene knockouts was also used to improve production of amino acids L-threonine and L-valine in E. coli (Lee et al., 2007; Park Jin et al., 2007; Park et al., 2011), succinate (Lee et al., 2005; Wang et al., 2006), and malate (Moon et al., 2008). By linking growth rate with the rate of product formation, gene knockout targets were identified, which resulted in the improved production of 1,4-butanediol (Yim et al., 2011). The genome-scale model was also used to guide strategies to enhance lycopene production in E. coli through identifying gene amplification targets by using flux scanning built on enforced objective flux (Choi et al., 2010). Thermodynamic analysis and flux balance analysis were used to improve taxadiene biosynthesis as the native non-mevalonate pathway in E. coli was found to be more energetically favourable for taxadiene production (Meng et al., 2011). In another approach integrating -omics, 13C metabolic flux analysis has been used to identify reactions causing bottlenecks in lysine formation (Becker et al., 2011). Even though these studies highlight the usefulness of genome-scale metabolic models in improving the phenotype of the overproduction strains, there are other issues that cannot be resolved when using such models. For instance, in a study on enhancing lycopene production, gene targets identified for improved phenotype using the stoichiometric model were found to mainly affect regulatory genes, whereby deleterious effects were detected when the gene deletion targets determined by resequencing were combined (Alper et al., 2005). In another study on identifying amplification targets for putrescine production, the authors observed false-positive targets probably due to transcriptional and translational regulation that could not be accounted for (Park et al., 2012). In improving vanillin production, some incorrect predictions were made which led the authors to believe that using only stoichiometric models can result in unrealistic flux predictions when kinetic constraints or regulatory interactions are not accounted for (Pharkya et al., 2004). In a study on xylitol production, the stoichiometric model could not account for the inhibitory effects of metabolites (Chin et al., 2009), while in another study, authors found a novel pathway for central carbon metabolites for E. coli mutant strains by incorporating both metabolomics and fluxomics after discovering incorrect predictions made using the stoichiometric model (Nakahigashi et al., 2009). These studies show that while constraint-based models can improve strain design, such models cannot capture regulatory and kinetic interactions which can be altered to enhance target compound production in strains.
Even though constraint-based metabolic models have been beneficial in improving the yields of target compounds, there are some drawbacks associated with such models as they are based on steady-state assumptions. Furthermore, these constraint-based models cannot determine the associations between enzyme expression, metabolic flux, metabolite concentrations, and regulation which is feasible with dynamic models (Saa and Nielsen, 2017).
3.2. Dynamic-based modelling
Dynamic-based or kinetic models are particularly suitable when studying dynamic effects in systems as they are more predictive (Tummler and Klipp, 2018). For instance, kinetic modelling has been used to study interferences in regulatory networks. Using a kinetic model of glycolysis, over 100 alleged allosteric interactions were tested based on dynamic data, where allosteric interactions that reversibly regulate the changes between glycolysis and gluconeogenesis were identified (Link et al., 2013). In another study, variable allosteric terms were used in Michaelis-Menten rate laws to fit data of fluxes, metabolite, and enzyme concentrations on a reaction-by-reaction basis (Hackett Sean et al., 2016).
As kinetic models portray systems in terms of kinetic parameters, ‘bottom-up’ models of metabolism have been created where during model parameters determination either predicted or measured enzyme kinetic properties are utilized (Strutz et al., 2019). However, there could be unrealistic model behaviour when using in vitro enzyme properties due to the lack of consideration of regulatory effects (Heijnen and Verheijen, 2013) and data varying in substantial amounts from actual in vivo experiments (Selvarajoo et al., 2009; Teusink et al., 2000; Magnus et al., 2006). It is also challenging to create a dynamic model using a bottom-up approach due to uncertainties associated with the kinetic properties of enzymes and associated reactions (Andreozzi et al., 2016; Schaber et al., 2009). Furthermore, it is rather difficult to determine enzyme reaction kinetics for all pathway or network reactions, rendering this approach more appropriate for small-scale models. In one approach Michaelis-Menten rate law approximations, which utilizes kinetic data, was used to substitute detailed rate laws for well-characterized reactions (Du et al., 2016). In another approach, structural kinetic modelling, local linear models were used in the investigation and statistical analysis of each point in the parameter space allowing for biochemical interpretation without requiring explicit knowledge on the kinetic models with enzyme kinetics and rate equations (Steuer et al., 2006). The intricate and non-linear nature of associations between metabolites can also affect the effectiveness of optimization algorithms used to determine model parameters in bottom-up approaches (Cuperlovic-Culf, 2018; Srinivasan et al., 2015).
In a ‘top-down’ modelling approach, dynamic metabolomics data is utilized to deduce the flux rates, kinetics, or metabolite concentrations by establishing causation and correlation networks between metabolites (Cuperlovic-Culf, 2018). The cause-effect associations amongst metabolites in a network is typically created using metabolomics data collected in a time series whilst the correlation network utilizes statistical and mathematical tools to understand the likely association between metabolites and enzymes in a network (Srinivasan et al., 2015). The generation of in vivo time-series metabolite data is crucial for determining enzyme kinetics intracellularly (Chassagnole et al., 2002; Nikerel et al., 2006). In order to generate this data, appropriate methodology needs to be applied for quenching metabolism, extracting and quantifying the intracellular metabolites (Villas-Bôas et al., 2005b). With this data in hand, kinetic parameters in dynamic models can then be deduced. Dynamic models of metabolism have been constructed for central metabolites using mechanistic rate equations and time-series metabolite data in E. Coli(Chassagnole et al., 2002) and in S. cerevisiae (Rizzi et al., 1997; Theobald et al., 1997). Time-series data of metabolites allow for the development of kinetic models which describe metabolite dynamics (Link et al., 2014). Fig. 1 explains kinetic modelling of the generated dynamic time-series data of metabolites. In another approach to reduce model complexity, linlog kinetics was applied to artificially generated time-series metabolite data resulting in a kinetic model with estimated parameters (Kresnowati et al., 2005). Linlog kinetics was also applied with dynamic metabolite data from bacteria to model concentrations and fluxes in the valine/leucine pathway (Magnus et al., 2006). Furthermore, convenience kinetics has also been used as an approximative kinetic rate format to reduce model complexity (Liebermeister and Klipp, 2006).
As with the bottom-up approach, the top-down approach also utilizes optimization algorithms to estimate model parameters, which has its limits due to possible non-linear associations between metabolites and the diverse range of kinetic parameters and concentrations (Cuperlovic-Culf, 2018). However, top-down approach has been successfully utilized with little parameter sensitivity in the analysis of cellular pathways using simple mass-action kinetic models or linear response reactions (Selvarajoo et al., 2009; Selvarajoo, 2011).
3.3. Machine learning
The limitations of current modelling approaches and the accumulation of vast amounts of multi-omics data raises the need to involve innovative data analytic and mining methods, such as artificial intelligence (AI). AI is a branch of computer science that develops computer programs capable of performing tasks that usually require human intelligence. The AI programs follow pre-determined rules or search for pattern in the data so that it can make independent decisions (Helmy et al., 2020). Several research fields in the biomedical sciences are taking advantage of AI such as in accelerating the drug discovery through developing advanced analytics for large-scale data. Although AI is heavily utilized in the fields of genomics, signalling pathways prediction and analysis, protein-DNA binding, protein-protein interaction prediction and cancer diagnosis amongst several other applications (Alipanahi et al., 2015; Hui et al., 2013; Poplin et al., 2018), AI is not similarly employed in the systems metabolic engineering field. Although the idea of using AI is relatively old (Zelezniak et al., 2018), this promising technology is still under-utilized.
Machine learning (ML) is a branch of artificial intelligence concerned with the usage of computational algorithms to perform specified tasks through the process of (1) identifying useful patterns from some data (data mining), based on which, (2) inferences and then decisions are made on the course of actions, with minimal human intervention. This field has significantly and continuously improved in the last few years and proved very useful in analyzing large-scale data generated using analytical and experimental platforms. Recent reports show ML applications in the discovery of food identity markers (Erban et al., 2019), identifying weight loss biomarkers (Dias-Audibert et al., 2020) and farm animal metabolism (Ghaffari et al., 2019). In systems metabolic engineering, the integration of ML and systems biology has several promising applications including pathway discovery (Cuperlovic-Culf, 2018; Quest et al., 2010), identifying essential enzymes (Plaimas et al., 2008; Nandi et al., 2017), genome annotation (Yip et al., 2013), protein modelling (Billings et al., 2019; Yang et al., 2020) and engineering bio-economy strains (Costello and Martin, 2018). Applications of ML in the field have been reviewed in several recent articles (Choi et al., 2019; Helmy et al., 2020; Volk et al., 2020).
ML methods can be classified into two main categories, as illustrated in Fig. 3. The first is supervised learning, whereby the objective is to derive a model for predicting the output variables-of-interest based on some input variable values by learning from instances of input-output pairs, whereas for the second category, unsupervised learning is aimed at the exploration of variations and relationships among data variables. Supervised learning can be further divided into classification and regression methods, to facilitate their understanding and choice of application. Classification is used, when the output(s) to be inferred is/are categorical, i.e. discrete and few in numbers, whereas regression is more relevant for continuous outputs. However, some methods, such as artificial neural network and support vector machine, can be used for both classification and regression. Unsupervised learning can be further classified into either clustering algorithms for grouping data points (samples) based on inherent similarities, or association algorithms for uncovering hidden trends or rules among the variables of data points.
 Fig. 3. Machine learning models to analyze and interpret multi-omics data. Validation of predictions is required after the application of the appropriate machine learning approach. The new data generated can be used to improve the learned model, enhance prediction performance, and aid in designing new experiments for data generation based on biological hypotheses.
Chosen judiciously, ML methods are well suited for addressing specific challenges associated with high throughput multi-omics studies (Mirza et al., 2019). ML can also be utilized for processing MS spectra during analysis of metabolites, where supervised machine learning methods can aid in picking peaks, missing data imputation, and normalization (Liebal et al., 2020). Omics datasets generally have many more variables than samples and are thus saddled with the so-called ‘curse of dimensionality’. The latter refers to the overfitting of explanatory model by too many variables, whereby the model appears predictive on training data, but are otherwise not generalizable to new observations. It is also challenging to identify meaningful variables from the large pool. In this regard, ML approaches can be applied to reduce the feature size by projecting the high dimensional data to a lower dimensional space (Hira and Gillies, 2015; Dekermanjian et al., 2022; Faquih et al., 2020). Some examples of such ML methods are non-negative matrix factorization (NMF),