1. Introduction
Storm surges can lead to excessive dune erosion with devastating floods as a potential consequence. Barrier islands and low-lying countries protected by dunes are especially vulnerable to dune erosion. To assess the risks these areas face, an understanding and description of the physical processes that take place during dune erosion can be of value.
Storms can be classified into four regimes with different levels of impact (Sallenger, 2000). These regimes are the (1) swash regime, (2) collision regime, (3) overwash regime and (4) inundation regime. This review confines itself to dune erosion in the collision regime, when the total water level exceeds the dune foot causing waves to collide with the dune face and force erosion. The eroded sand is transported offshore where it settles in the outer surf (Fig. 1).
The induced damage to the dunes in the collision regime can be significant. On January 3 1976, a 1:20 year storm collided with the Dutch coast, resulting in dune retreat of 6–10 m along the Holland coast (Vellinga, 1978). In more recent times, Masselink et al. (2016b) reported erosion volumes of over 200 m/m along the beaches of Cornwall, UK, after the extreme storms during the winter of 2013/2014. Some of these beaches were completely stripped of sediment and exposed a rocky shore. Castelle et al. (2015) observed, for the same winter, a beach retreat of 20–30 m and average scarp heights of 6–8 m at erosion hotspots along the Gironde coast (France). Harley et al. (2016) analysed the 2007 and 2015 East Coast Lows at Narrabeen beach, Australia, and found average erosion volumes of 78 and 57 m/m, and a landward retreat of the subaerial beach of 28 and 19 m respectively.
This paper presents an overview of current knowledge on dune erosion in the collision regime. In the Section 2, field observations, laboratory experiments and manipulative field campaigns with regards to this topic are introduced. The Section 3 describes the relevant physical processes triggering erosion. The Section 4 summarises developed models to predict storm impact. In the Section 5 and final section, conclusions are drawn based on the information presented in this review.
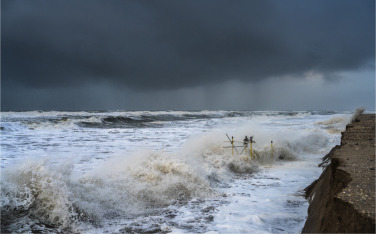
 Fig. 1. Damage during the collision regime at the Holland Coast, the Netherlands (2022, Ph. Mischa Keijser).
 Fig. 2. Dune erosion at the coast of Vlieland, the Netherlands. Photograph by van Houdt (Dutch Ministry of Infrastructure and Water Management) (2008).
2. Field and laboratory observations of dune erosion in the collision regime
2.1. Field observations
Field observations of dune erosion in the collision regime can date all the way to the 18th century (Baart et al., 2011). The observations can be a valuable tool for analysing dune erosion, as a coastal stretch is investigated under real-life conditions ensuring the inclusion of all relevant processes. Still, storm conditions prove dangerous for surveyors, making detailed temporal observations difficult and therefore limited. Researchers have often turned to pre- and post-storm surveys to determine morphologic change during the storm. The beach and dune morphology can be recorded using an RTK GPS(Seymour et al., 2005, Harley et al., 2016, Masselink et al., 2016a), LiDAR (both terrestrial and airborne) (Bonte and Levoy, 2015, de Winter et al., 2015, Overbeck et al., 2017), or photo imaging (Lippmann and Holman, 1990). The temporal characteristics of storm hydrodynamics have been recorded using different instruments, of which pressure sensors, velocimeters (both acoustic and electromagnetic), and wave buoys are used frequently (Reniers et al., 2004b, Seymour et al., 2005, Senechal et al., 2011, de Winter et al., 2015).
During storms, large hydrodynamic forcing changes the underwater profile, the beach and the dunes. Complex three-dimensional surf zone structures, indicating variability in alongshore direction, are usually destroyed, resulting in a linear uniform bar-trough system, after the classification of Wright and Short (1984) (Fig. 2) (Lippmann and Holman, 1990, Thornton et al., 1996, Stive and Reniers, 2003, Ranasinghe et al., 2004). This process is sometimes referred to as a morphological beach reset. Price and Ruessink (2011) stipulate the importance of the wave angle of incidence for this reset, as oblique waves trigger an alongshore current which can straighten alongshore bars. For example, Castelle et al. (2015) found that a normally incident high energy event increased alongshore variability by triggering megacusp formation due to the absence of alongshore currents.
In cross-shore direction, the post-storm dune profile (Fig. 2) commonly shows a newly formed dune toe which can be related to the maximum water level or a certain wave runup level (Bonte and Levoy, 2015, van Bemmelen et al., 2020, de Winter et al., 2015). Above the dune toe, a scarp or steep slope can be observed, running upward to the top of the dune, under an angle of approximately 45(Vellinga, 1978, Moller and Swart, 1988, Nishi et al., 1994, Splinter and Palmsten, 2012, de Winter et al., 2015). Below the dune toe, bed perturbations are suppressed and advected offshore during the storm, resulting in a smooth beach profile (Birkemeier et al., 1988, Steetzel, 1992, Stive and Reniers, 2003). Outer surf and offshore sand bars that were present before the storm usually migrate offshore during storm conditions (Gallagher et al., 1998).
2.2. Laboratory experiments
During the second half of the 20th and the beginning of the 21st century, numerous laboratory experiments were conducted to investigate dune erosion (see Table 1 for an overview). Within a confined laboratory environment where the hydrodynamic forcing could be controlled, it became possible to investigate the influence of specific hydrodynamic and morphodynamic parameters individually in time. The temporal evolution of the bed profile could also be recorded, which was less straightforward in field conditions. Moreover, due to the sheltered and controlled environment, more sophisticated measurement devices could be used, such as the stereo video imagery (Van Thiel De Vries et al., 2007, Palmsten and Holman, 2012).
Inside a wave flume, coastal profiles were built as a physical model. Scale factors were applied if the prototype sizes were too large for a laboratory. Small and large scale factors were applied to generate a laboratory setup capable of capturing dune erosion processes (van de Graaff, 1977, Hughes, 1981, van Gent et al., 2008, Palmsten and Holman, 2012). At the offshore boundary of the flume, a wave machine (e.g. wave piston or paddle) generated the hydrodynamic conditions. Vellinga, 1986, Arcilla et al., 1994, and van Gent et al. (2008) performed tests in the Deltaflume of the Delft Hydraulics facility (Fig. 3). With an effective length of 225 m from the wave paddle, a width of 5 m and a depth of 7 m, its large dimensions accommodated horizontal spatial scalefactors ranging from 1:5 to 1:1, of which the latter meant the prototype size was represented in the physical model.
| Location | (m) | (s) | (m) | () | Reference | |
|---|---|---|---|---|---|---|
| Delta Flume (NL) | – | 1.4 | 5 | 4.6 | 220 | Arcilla et al. (1994) |
| 6 | 0.5–1.5 | 4.90–7.35 | 4.5 | 200 | Van Thiel De Vries et al. (2007) | |
| van Thiel de Vries et al. (2008) | ||||||
| van Gent et al. (2008) | ||||||
| Oregon State University (USA) | 6 | 1.3 | 4.9 | 0.17 | 230 | Palmsten and Holman (2012) |
| Delft Hydraulics Laboratory (NL) | 150, 84, 47, 26 | 0.05, 0.09, 0.16, 0.29 | 0.98, 1.31, 1.75, 2.35 | 0.03, 0.06, 0.11, 0.19 | 150–225 | van de Graaff (1977) |
| University of Florida (USA) | 25 | 0.07–0.12 | 0.97–1.357 | 0.10–0.17 | 152 | Hughes (1981) |
| Delta Flume (NL) | 5, 3.27, 1 | 1.5, 1.85, 2.00 | 5.4, 5, 7.6 | 4.2, 4.2, 5.00 | 150–225 | Vellinga (1986) |
| Delft Hydraulics Laboratory (NL) | 84, 47, 26 | 0.091, 0.163, 0.292 | 1.31, 1.76, 2.35 | 0.19, 0.11, 0.06 | 95, 130, 150, 225 | Vellinga (1981) |
| Vellinga (1986) | ||||||
| Delta Flume (NL) | – | 1.4 | 5 | 4.6 | 220 | Arcilla et al. (1994) |
| North Carolina State University (USA) | – | 0.045–0.105 | – | – | 300 | Overton et al. (1988) |
| North Carolina State University (USA) | – | 0.045–0.141 | – | – | 220–780 | Overton et al. (1994) |
| ACE Mississippi (USA) | 10 | 0.06–0.20 | 2.2 | 0.53–0.58 | 130 | Erikson et al. (2007) |
| Texas A&M University at Galveston (USA) | – | 0.05 | 0.8 | 0.18 | 140 | Figlus et al. (2014) |
| IIUNAM (Mexico) | – | 0.10, 0.15 | 1.118, 1.5652, 2.012 | 0.50 | 142 | Silva et al. (2016) |
| Texas A&M University (USA) | 1 | 0.0431–0.0503 | 19.50 | 0.18 | 500 | Feagin et al. (2019) |
Flume experiments were performed by van de Graaff (1977) and Vellinga (1981)to investigate the effect of the sediment grain size on the post-test dune profile. For beaches containing fine sediment with smaller settling velocities, which are associated with smaller grain sizes, they found larger total erosion volumes, a wider settling area, and a post-test profile with a milder beach slope and a lower dune toe. Later, Vellinga (1986) analysed the effect of different hydrodynamic parameters on the shape of the post-test profile. In both small and large scale flume experiments, he exposed the same dune to different hydrodynamic conditions. The post-test profiles showed similarities in shape, and he reasoned that a beach profile under storm conditions moves towards an equilibrium profile with respect to these storm conditions. Based on this reasoning and the results of the experiments, Vellinga developed the equilibrium model DUROS, which predicts the post-storm dune profile using the storm conditions and the properties of dune sediments. van Gent et al. (2008) later included the wave period in Vellinga’s model, after large-scale flume tests revealed larger wave periods led to increasing dune erosion volumes. Moreover, van Gent et al. (2008) observed the presence of 2 stages in dune erosion. The initial stage consists of up-rush and backwash over the dune face and results in drag-induced erosion. This stage continues until the erosion causes the dune face to be nearly vertical or overhanging. At this point the second stage commences during which slumps of sediment fall down the dune face intermittently, a process referred to as avalanching.
 Fig. 3. Upper left: Large scale test in the Deltaflume performed by Vellinga (1982) (photograph from Vellinga (1986)). Upper right: Large scale test in the Deltaflume performed by van Gent et al. (2008) (photograph from same paper). Lower panel: schematisation of the Delta flume tests of van Gent et al. (2008).
This second stage in which avalanching occurs was studied intensively by Overton et al., 1994, Van Thiel De Vries et al., 2007, Erikson et al., 2007 and Palmsten and Holman (2012). The response of the dune face to a single bore was studied using small-scale flume experiments by Overton et al. (1988). Each bore was generated by filling a head tank with water and releasing the water at once by raising the front gate. Eroded volumes from the dune were computed using photographs taken perpendicular on the wave flume, and could be correlated to the impact of the waves. Later, Overton et al. (1994) used a similar flume setup to study the effect of sediment grain size and dune compaction on dune face response. A dune was again exposed to one single bore, but this time the dunes were built with either a coarse sediment from North Carolina or a fine grain sand from Oregon. Within each sediment type, tests were performed with a dune with a high density or compaction, and a low density or compaction.
The types of soil failure leading to avalanching were studied in small-scale experiments by Erikson et al. (2007). An eroding dune was replicated using a vertical dune face and an equilibrium beach profile below it according to Dean (1977). In the experiments, dunes were subjected to waves until sufficient erosion occurred at the base of the dune to cause a slump to fall down.
The temporal variability and frequency of occurrence of avalanching was studied by Palmsten and Holman (2012) using stereo imagery. With images from 2 cameras, 3D reconstructions of an eroding dune were made before and after multiple wave impacts. In the experiments they observed that (1) dune erosion occurred only after water had infiltrated the dune for some time, (2) the slump usually involved only the wetted segment of the dune and (3) a stable state was reached when the dune toe eroded backwards and upwards, reducing the scarp height (Palmsten and Holman, 2011).
More recently, the effect of vegetation on avalanching has been investigated using flume experiments (Kobayashi et al., 2013, Figlus et al., 2014, Silva et al., 2016, Feagin et al., 2019). Kobayashi et al. (2013) used wooden dowels as an artificial representation of vegetation. Figlus et al., 2014, Silva et al., 2016 and Feagin et al. (2019) used actual vegetation in their flume experiments. The experiments showed that vegetation could both increase and decrease dune erosion volumes.
Still, laboratory experiments do not offer full closure to understanding all important processes during dune erosion. Natural conditions are not fully represented within laboratory experiments and there are chances that certain important natural processes are improperly replicated or overlooked. Especially, 2DH effects and associated alongshore variability cannot be included in flume experiments.
2.3. Manipulative field campaigns
The concept of manipulative field campaigns has been developed over the last decades to investigate dune erosion. In manipulative field campaigns, a field setup is built or altered in such a way that dune erosion is forced or very likely to occur under already moderate and therefore more frequent events. This increases the probability of acquiring field data on specific dune erosion processes. Other advantages are that (1) dangers and difficulties for observers in the field decrease because the conditions are less severe, (2) all natural processes, both cross-shore and alongshore, are included, and (3) the costs are usually lower than that of laboratory experiments.
Examples of manipulative field experiments are described in Fisher et al., 1986, Larson et al., 2004b, van Bemmelen et al., 2020, and Schweiger et al. (2020). Fisher et al. (1986) recreated a small dune in the swash zone to be attacked during high water, with the purpose of validating the linear relationship between the swash force and dune erosion volumes formulated in Fisher and Overton (1985). Larson et al. (2004b) changed the foreshore slope of 2 Pacific beaches in Japan with a bulldozer to see how and what sediment transportrates forced the beach back to its initial equilibrium. van Bemmelen et al. (2020)created several artificial mounds of sand in the intertidal zone, comparable to small-scale dunes, to investigate how beach scarps form and how the position of the dune toe changes during wave attack. Schweiger et al. (2020) created an artificial dune just above the high water line to evaluate how the model XBeach predicts dune erosion in the collision, overwash, and inundation regime after Sallenger (2000). The dune had an initial depression at its centre in alongshore direction, which forced inundation to occur there.
In general, manipulative field experiments provide the opportunity to investigate real-life conditions in a semi-controlled setting. In this semi-controlled setting, highly energetic conditions can be studied in detail while dangers for researchers are reduced.
In summary, field observations, laboratory experiments, and manipulative field experiments have given more and crucial insights in relevant hydrodynamic and morphodynamic processes occurring during dune erosion. These insights provided the basis for the development and validation of new theories and models, which form a valuable contribution towards a more comprehensive description of relevant processes and new predictive techniques.
3. Processes in dune erosion during storm surges in the collision regime
3.1. Types of sediment transport in dune erosion
Roughly two types of sediment transport can be distinguished: (1) transport due to hydrodynamic forcing and (2) transport due to avalanching of the dune face (Fig. 4). Sediment transport due to hydrodynamic forcing occurs in the surf and swash zone (Larson et al., 2004b, Masselink et al., 2005). Sediment transport due to avalanching is driven by soil instabilities and gravity, and occurs in the swash zone, on the dune face, and on the dune crest (Erikson et al., 2007, van Gent et al., 2008). Both will be elaborated upon separately in the sections below. Each section will first give a general description of the different mechanisms governing the type of transport, followed by an illustration of these mechanisms using run 2E of the LIP11D experiments described in Arcilla et al. (1994).
 Fig. 4. Sediment transport due to hydrodynamic forcing occurs in the surf and swash zone (, red arrow). Sediment transport due to avalanching occurs in the swash zone, on the dune face and on the dune crest (slumps with slide down the dune face, black arrow). Overall, sediment is eroded from the dunes and transported offshore towards the outer surf-zone.
3.2. Sediment transport due to hydrodynamic forcing
3.2.1. General description
Waves and wave-induced currents erode sediment from the bed and transport it elsewhere. To describe the transport of sediment and the resulting bed level changes, many authors use the continuum approach, in which spatial differences in sediment transport are linked to bed level changes in time (e.g. Steetzel, 1993, Reniers et al., 2004a and Roelvink et al. (2009)). Here, this approach will also be used to describe the important physical processes. In such a continuum approach, the horizontal transport of sediment at location can be conceptualised and written as the product of the horizontal flow velocity and sediment concentration (Steetzel, 1993): (1)
In this expression is the time varying horizontal sediment transport rate integrated over depth, is the time varying horizontal velocity vector at vertical location , is the time varying sediment concentration at vertical location , is the average water depth and the time varying free surface elevation. During storm conditions, suspended sediment concentrations dominate over bed load (Ruessink et al., 1998), which means that vertical gradients in concentrations are limited.
Spatial gradients in the depth integrated sediment transport rates cause temporal changes in bed elevation (). In other words, when sediment transport rates increase (decrease) in the direction of flow, sediment has been picked up from (deposited on) the bed and erosion (deposition) must have occurred. This can be described using an Exner equation (e.g. Roelvink et al. (2009)), (2)with being the porosity of the sediment. By quantifying velocities and sediment concentrations, sediment transport rates can in theory be computed using Eq. (1). The bed level changes can then be approximated using Eq. (2). However, the magnitude and amount of complexities involved in nearshore hydro- and morphodynamics makes this approximation very difficult. Therefore, some authors choose separating the hydrodynamic processes into different scales to account for the most significant processes and to average out small-scale complexities (Steetzel, 1993, Reniers et al., 2004a). A possible assumption is that high-frequency wave motion and turbulence are the stirring agent, and time-averaged and low-frequency wave motion are the transporting agent. Together, they drive the morphodynamics (Bowen and Doering, 1984, Vellinga, 1986, Steetzel, 1993, Smith and Mocke, 2002, Reniers et al., 2004a).
In this review, we separate the processes that govern sediment transport due to hydrodynamic action into processes on a wave-averaged, infragravity (IG), and intra-wave/micro timescale. This order was chosen because early formulations and process studies have focused on wave-averaged processes. Later, it was found that infragravity motions drive nearshore hydrodynamics. More recently, intra-wave and micro-timescale processes have been given more attention in process descriptions regarding dune erosion.
Wave-averaged timescale (300 )
On a wave-averaged timescale, the vertical velocity structure in the surf zone is driven by wave breaking (Dyhr-Nielsen and Sørensen, 1970, Steetzel, 1993). In cross-shore direction, velocities are onshore directed in the upper section of the water column due to breaking-induced radiation stresses (Fig. 5). In the lower section of the water column, these onshore velocities are balanced by the offshore directed return current and undertow, which are strongest in the lower part of the water column and in regions where wave breaking is most intense (Stive and Wind, 1986, Reniers et al., 2004b). The fact that flow velocities are offshore directed in the lower part of the water column has implications for the transport of sediment, because here sediment concentrations are generally larger (Steetzel, 1993). In alongshore direction, oblique waves drive a wave-averaged current in the alongshore direction (Bowen, 1969, Longuet-Higgins, 1970). The alongshore current is greatest at the location of wave breaking. Here radiation stresses are largest and balanced by the bed shear stress induced by the alongshore current (Thornton and Guza, 1986). Tidal currents are often categorised under the wave-averaged timescale because a tidal period is of larger order than the period of individual waves. The combination of all wave-averaged currents form an important driver for sediment transport.
Infragravity timescale (30 s 300 )
 Fig. 5. Mean cross-shore () and alongshore () velocity profiles driven by wave action. WB stands for wave breaking.
On a timescale of approximately 30–300 s (after the classification of Munk (1950)), local hydrodynamics are dominated by infragravity waves (Fig. 6). These waves are generated by wave groups and when generated, bound to their wave group (Hasselmann, 1962, Longuet-Higgins and Stewart, 1962, Longuet-Higgins and Stewart, 1964). They are released once the shorter waves of the group break, and when released, they can shoal, break and reflect on the beach as free waves (van Dongeren et al., 2007). Once reflected, they can remain in the surf zone (trapped or edge infragravity waves) or leave the surf zone and travel offshore, towards another coastal area (leaky infragravity waves, Herbers et al. (1995)). This means the incident infragravity wave field can contain both bound and free waves. A thorough review of infragravity waves is given in Bertin et al. (2018).
When wave conditions intensify to storm conditions, the increased contribution to nearshore hydrodynamics and dune erosion of infragravity waves is often dominant over that of short waves (Guza and Thornton, 1982, Bertin et al., 2018). This is because the intensification of offshore wave conditions leads to more energy within the low-frequency band, while the high-frequency band reaches saturation (Hughes et al., 2014, Fiedler et al., 2015). The increased infragravity energy leads to a stronger variation of the free surface and orbital velocities, a larger vertical range of the total runup levels, and more energetic infragravity bores on a timescale of 30–300 s. During periods of high water, in the crest of an infragravity wave, short wave energy and hydrodynamic action can reach further inland resulting in higher runup levels (Raubenheimer and Guza, 1996), and more wetting of the dune face. This wetting is important for avalanching (Palmsten and Holman, 2011). In the trough of an infragravity wave, the amount of depth-induced wave breaking increases, which increases the amount of sediment in suspension (Smith and Mocke, 2002). Depending on the time-varying net direction of flow at this location of intensified wave breaking, sediment transport can be either onshore or offshore (e.g. Osborne and Greenwood, 1992, Smith and Mocke, 2002 and Aagaard and Greenwood (2008)). In the swash zone, the backwash of infragravity waves themselves can attain considerable flow velocities, thereby exceeding a certain threshold for motion and stimulating offshore sediment transport (Osborne and Rooker, 1999).
Intra-wave and micro timescale (30 )
 Fig. 6. Timeseries of a wave gauge deployed early 2022 at the Dutch coast near Kijkduin, the Netherlands. Through spectral analysis, the timeseries can be seperated into a wave-averaged signal (upper panel), infragravity signal (lower left) and intra-wave signal (lower right).
Processes occurring on the intra-wave and micro timescale contribute more to the concentration of suspended sediments (Smith and Mocke, 2002). van Thiel de Vries et al. (2008) performed qualitative experiments in the Deltaflume to investigate relevant processes that contribute to sediment concentrations. In the inner surf zone, which is dominated by wave breaking, the increased concentrations correlated well with the presence of steep, unstable wave fronts. Steep waves cause a larger pressure gradient, which results in a larger force exerted on the bed and increases sediment concentrations (Madsen, 1975, Masselink and Puleo, 2006). The instabilities at the wave front generate turbulence, which can reach the bed as a pulse and stir up sediment (Dally and Dean, 1984, Roelvink and Stive, 1989, Butt et al., 2004). Because longer waves can attain a larger wave steepness, longer waves are more efficient in stirring up sediment, leading to increased dune erosion volumes (van Thiel de Vries et al., 2008). The increased concentrations in the surf zone measured by van Thiel de Vries et al. (2008) correlated less well with the measured near-bed flows and the associated bed shearing, contradicting earlier measurements such as van Rijn (1984) and Nielsen (1992).
Sediment concentrations are up to one order of magnitude larger in the swash zone when compared to the surf zone (Osborne and Rooker, 1999, Butt and Russell, 1999, Masselink et al., 2005). Puleo et al. (2000) analysed suspended sediment concentrations at three cross-shore locations in the swash zone using velocity, sea surface, and sediment concentration measurements. Significant differences in underlying processes are present between the uprush and backwash in the swash zone. During uprush, bore-generated turbulence (turbulent kinetic energy) strongly and directly influenced local suspended sediment concentrations. The suspension was high and nearly vertically uniform above the lower 1–2 cm of the water column. Just before flow reversal, the sediments settled rapidly. After flow reversal, backwash sediment concentrations increased with flow duration, but this time the distribution was less uniform with highest concentrations in the region very near to bed, with strong gradients going upward.
The effectiveness of the processes above to stir up and transport sediment depends on the shape (Cohn et al., 2019) and morphologic characteristics of the beach and dune system, including sediment grain size and dune compaction or density (Davidson et al., 2020). Vellinga (1981) found experimentally that smaller grain sizes yield larger dune erosion volumes, a wider area of sediment deposition with a milder slope (in cross-shore direction), and a higher post-storm dune toe. Vellinga’s findings were confirmed numerically by Kriebel and Dean (1985).
3.2.2. Illustrations of the described hydrodynamic processes using run 2E of the LIP11D experiments
In 1993, the LIP11D experiments were carried out in the Delta Flume, the Netherlands, to identify the important physical processes in dune erosion (Arcilla et al., 1994). In test 2E, a dune with a crest just below 6 m was subjected to an 18 h storm with a surge level (SSL) of 4.6 m, a significant wave height of 1.4 m and a peak period of 5 s (Table 1). Among the deployed instruments was a measurement carriage equipped with, among other instruments, 5 velocimeters and 10 suction tubes which sampled sediment concentrations once each hour. During the storm simulation, wave conditions were run for one hour and then paused to record bed profiles using a bed profiler and shift the carriage to a new cross-shore position. Fig. 7 displays the vertical mean cross-shore velocity profiles and the sediment concentrations recorded by the suction tubes at several cross-shore positions, and the bottom profile at the beginning of the experiment and after 8 h of wave conditions.
Wave breaking commences at the bar at approximately x 130 m (Fig. 7, upper panel), resulting in a larger offshore-directed wave-averaged undertow near the bed at locations x 145 m, 152 m, and 160 m. This increase does not necessarily result in larger sediment concentrations, as location x 160 m displays considerably higher concentrations for similar flow velocities. These higher concentrations are consistent with the notion that sediment concentrations in the swash zone are one order of magnitude larger than in the surf zone (Osborne and Rooker, 1999, Butt and Russell, 1999, Masselink et al., 2005).
 Fig. 7. LIP11D experiment 2E. (a) Significant wave height along flume based on pressure sensors. (b) Profile change after 8 h of storm conditions, and during 1 h wave-averaged flow velocities (crosses), , and sediment concentrations (open circles), , along 7 cross-shore transects based on carriage measurements. The measurement locations of the velocities are denoted with filled circles. The black dotted line represents the mean water level (MWL).
3.3. Sediment transport due to avalanching
3.3.1. General description
On the dune face, on the dune crest, and partially in the swash zone, dune erosion is driven by sediment transport due to avalanching. Avalanching is initiated by soil instabilities, and is a recurring process in which slumps of sediment slide down the dune face repeatedly due to gravity (van Thiel de Vries et al., 2008). These slumps provide a source of sediment for the transport driven by hydrodynamic action in the swash and surf zone (Fig. 8).
The instabilities are caused by the waves colliding with the dune face. These waves erode the lower part of the dune face through drag induced sediment transport, gradually steepening the dune face. The steepening can be accompanied by the formation of a notch at the dune toe (Erikson et al., 2007). At the same time, water infiltrates the front horizontally due to capillary action, and this infiltration increases the apparent cohesion of the wetted sediments (Palmsten and Holman, 2011). This apparent cohesion can cause a dune face with a slope well exceeding the angle of repose of dry sand (45, e.g. Nishi et al. (1994)). The steepening can continue until the dune face is nearly vertical or overhanging. This, together with a potential notch, leads to a very unstable dune face which will eventually fail. The failure mechanism can either be of the shear-type or beam-type. With shear-type failure the weight of the overhanging layer of sediment becomes too large causing a block of sediment to fall down. With beam-type failure, a tensile crack forms more landward of the unstable front and a portion of the dune slides down. Erikson et al. (2007) observed beam-type failure more frequently than shear-type failure in their experiments.
 Fig. 8. Sediment transport due to soil instabilities displayed as a continuous cycle. (1) drag-induced erosion (S) removes sediment below the maximal runup level (), steepening the dune face up to angles exceeding the natural angle of repose of dry sand (). (2) incoming swash collides with the dune scarp, wetting dune sediments. At a certain moment, the weight of the wetted sediments (below the phreatic surface) and the dry layers above () exceeds the resisting shear forces (), resulting in a slump falling down (red arrow). (3) After collapse, the sediment from the fallen slump is brought in suspension and transported offshore (). (4) The cycle restarts.
The volume of the slumps have been related to the degree of horizontal infiltration (Palmsten and Holman, 2011). The apparent cohesion keeps the wetted sediment together and causes it to slump as a single unit. Given that the dry area of a dune is not influenced by apparent cohesion, the sediment above the wetted slump slides down along the angle of repose ( along in Fig. 8). This would imply that higher dunes reach larger erosion rates, as the dry volume is larger and the source of sediment to the swash zone increases. That higher dunes erode faster than lower dunes was confirmed in numerical studies by van Thiel de Vries et al. (2011) and Itzkin et al. (2021), and field observations by de Winter et al. (2015). In addition, they find larger erosion rates for steeper dunes, which could be attributed to the dune face becoming unstable faster because its initial slope is already quite steep.
The slumps that slide down the dune face temporarily defend the dune face from wave impact. The incident waves gradually transport the sediment of the fallen slump offshore until the dune face is exposed again. At this point the cycle as depicted in Fig. 8 restarts. With time, a new coastal profile develops with the sediment that slid down the dune face. This new profile decreases the amount of waves reaching the dune face, thereby decreasing in time the amount of sediment transported due to soil instabilities (Van Thiel De Vries et al., 2007).
Overton et al. (1994) studied the effect of sediment grain size and compaction on the volume of an individual avalanching event. A smaller grain size results in a larger capillary rise or a higher negative pore pressure within the dune, requiring a larger force to be eroded. With this reasoning, a smaller sediment grain size and larger compaction would result in smaller slumps. They confirmed these hypotheses in flume tests, in which the eroded volume of a vertical dune face after 1 single bore was analysed for dunes with different grain size and density, but identical foreslope.
The presence of vegetation on the dune face is important to consider when regarding sediment transport due to avalanching. However, the net effect of vegetation on dune erosion remains difficult to quantify due to the hydrodynamic, morphodynamic, and biologic complexities involved (Figlus et al., 2022). Multiple flume studies with real vegetation find smaller erosion rates and quantities for dunes covered with vegetation (Silva et al., 2016, Feagin et al., 2019, Mendoza et al., 2017, Odériz et al., 2020, Figlus et al., 2022).
During the initial stages of a storm, in which waves run up and down the foreshore and dune face, vegetation above the bed primarily reduce erosion by attenuating swash and run-up bores (Barbier et al., 2008, Feagin et al., 2019). The vegetation below the bed decreases erosion by increasing the cohesion of sediments, which increases the resistance of the dune (Figlus et al., 2014, Davidson et al., 2020), but it can also partially increase erosion through a process called uprooting: when vegetation is pulled out of the bed through hydrodynamic action their roots can take large portions of sediment with them. Once the vegetation is pulled out, the roots attenuate waves and reduce erosion (Feagin et al., 2019). Figlus et al. (2014) finds that the below-ground effects are more significant due to the relatively short extent of the above-ground vegetation in the cross-shore. During later stages of a storm and avalanching, dune vegetation and their roots can slow down dune retreat Figlus et al. (2014). This reduction was found to increase with an increase in vegetation maturity, which also enhanced resistance to vertical shearing.
3.3.2. Illustrations of the described hydrodynamic processes using run 2E of the LIP11D experiments
The processes discussed above can again be identified in run 2E of the LIP11D experiments, described by Arcilla et al. (1994). Fig. 9 displays the development in time of the foreslope, dune toe, and dune face due to the storm conditions described in Section 3.2.2. The upper panel displays profile development in time, and marks the location of the dune toe, which is defined as the location where the second derivative of the bed profile is maximal. The derivatives of the bed profile are computed using second order accurate central differences, after applying a moving average of 20 cm on this profile to remove noise. The lower panel of Fig. 9 displays the angle of the bed at each cross-shore location, computed using the tangent with central differences.
The amount of erosion and retreat of the dune crest decreases with time, in accordance with the findings of Van Thiel De Vries et al. (2007) and Palmsten and Holman (2011). The dune toe retreats backwards and upwards in time, but seems to converge to a vertical elevation of approximately 5.25 m after 6 h and remains at that vertical elevation more or less. Only at t 12 h the dune toe seems higher, possibly due to a slump event just before t 12 h, which is supported by the less distinct transition from foreslope to dune face in the profile at that time. Above the dune toe, the angle of the dune face appears to remain constant at 61°. The vertical level of 5.25 m to which the dune toe converges can be linked to the maximal water level because (1) once this elevation is reached, the sediment above the toe remains dry, confirmed by the constant angle of the dune face of 61°, and (2) according to Palmsten and Holman (2011) the infiltration decreases with time and with that the erosion decreases. This means the profile should converge to a profile in which the infiltration at the dune face approaches zero, which occurs when the dune base is at the height of the maximal water level.
 Fig. 9. Development of the foreslope, dune toe, and dune face in time for run 2E of the LIP11D experiments (Arcilla et al., 1994). Panel (a) displays profile development in time, and marks the location of the dune toe. The dotted line represents the mean water level (MWL) and the wave setup at x 170 m. Panel (b) displays the angle of the bed before the dune and dune face for each of the profiles. The dotted lines represent the mean of both angles.