1. Introduction
As we approach and the deadline for net zero draws nearer, it is clear that a key player in the decarbonisation of the grid is wind, having proven successful both onshore and offshore (Rhodri and Ros, 2015, UKGovernment, 2021, Carbon Trust, 2018). However, the number of available nearshore sites is reducing, pushing operators to explore further afield into deeper, further offshore sites with the scope for larger capacity deployments (Buljan, 2022). Traditional fixed platforms are no longer techno-economically feasible at these depths (Hannon et al., 2019, Eric Paya, 2020, Lefebvre and Collu, 2012, Carbon Trust, 2023, Tong, 1998), resulting in the requirement for floating solutions. However, new technologies come with inherent risks and generally higher costs (Rhodri and Ros, 2015, Maienza et al., 2020, Myhr et al., 2014, Catapult, 2017). This is particularly relevant given that the industry has not yet found an “optimum configuration” suitable for every situation. It is therefore predicted that there will be no such universal solution due to variation in site characteristics and lack of maturity in the floating offshore wind industry, the latter being one of the driving factors of increased cost (ABS, 2021, EU, 2014). It is for this reason that cost reduction is of the utmost importance, ensuring green secure electricity is still affordable to the user (ofgem, 2022). The CAPital EXpenditure (CAPEX) makes up around 75% (Maienza et al., 2020, Kausche et al., 2018) of the total cost, making it a key area for cost reduction. For floating wind the two highest costs that make up the CAPEX are the rotor-nacelle assembly and the floating support structure, each around 35% (Maienza et al., 2020). This research focuses on the floating support structure, due to its large contribution to the CAPEX (Catapult, 2022). At present, few studies have addressed the concept of an optimal support structure. Instead, the focus has been on determining an optimal rotor nacelle assembly design (Tanmay, 2018, Shires, 2013, Lovell and Doherty, 1994, Jureczko et al., 2005, Shourangiz-Haghighi et al., 2020, Barnes and Morozov, 2016, Medici, 2005, Wang et al., 2016, Fagan et al., 2018, Chen et al., 2017, Collecutt and Flay, 1996, Cencelli, 2006). Optimisation is a technique which has been highly utilised in the automotive and aerospace industry to find an optimal design (Muskulus and Schafhirt, 2014). This process covers a large design space in a much shorter time frame compared to traditional, iterative design methods, making it appealing for a less mature industry (Muskulus and Schafhirt, 2014). Given the similarities to the aerospace industry and the lack of experience, it is expected that optimisation will be a useful tool in determining the best floating offshore support structure for a given application (Uzunoglu et al., 2016). Due to the high complexity and dependency of floating offshore wind systems, it is expected that a multi-objective approach will be necessary. By applying a multi-objective approach and a number of design constraints, the best overall solution can be found by removing unfeasible options, even when there are conflicting objectives such as cost and performance (Pike-Burke, 2019, Venter, 2010). This paper aims to review the current literature, determining the shortfalls and the potential improvements to such optimisation approaches.
Following this introductory section, Section 2 details the approach adopted to find the analysed literature, and in Section 3, optimisation-related works will be reviewed looking at the considered design variables, constraints, objective functions, solvers, and numerical approaches implemented. Section 4 will provide a critical discussion, while Section 5 will conclude with a summary of the work’s findings and detail the proposed future work.
2. Literature review methodology
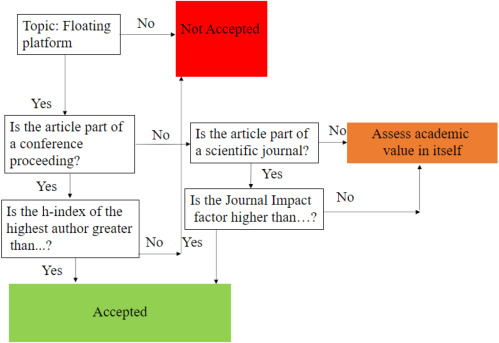
In order to conduct an extensive, yet relevant, review a wide range of keywords were used in a range of different search engines; these keywords include optimisation, floating offshore wind, and floating platform. This allowed a large number of papers to be collected. The most appropriate research from these papers were found by applying a number of criteria. The first criterion was to ensure the paper included the platform in the optimisation process, and this was not only restricted to floating offshore wind research, optimisation for Oil and Gas support structures were also considered. The second filter was based on the publication format of the research, i.e. firstly, if it was published in a conference proceeding, and if so, what was the highest h-index of the authors. If the index was above a set value the paper was used in the review. If the research was published in a scientific journal, the impact factor was reviewed, and if it was above the acceptable threshold, it was included. In the event that the journal impact or h-index was low, the author used their judgement to determine whether the article would be appropriate or not. Finally, if the research was published elsewhere the relevance and usefulness of the work was assessed by the authors. The explained methodology can be seen in Fig. 1.
The year of publication of each paper is reported in Fig. 2, this figure highlights that in recent years the topic has been increasingly growing in popularity within the industry.
 Fig. 1. Process for finding appropriate literature.
 Fig. 2. Number of publications per year.
3. Optimisation review
The outline of the subsequent Sections is as follows: Section 3.1 firstly details the generic multi-objective optimisation problem. The remaining Sections detail a review of the overall optimisation, objective functions, constraints, design variables and platform modelling, optimisation algorithms, modelling and additional software required, cost models used, and the overall outcome of each paper.
3.1. Optimisation problem methodology
The formulation, which details a general multi-objective design optimisation, can be expressed as (1)where defines the design vector, which contains the design variables which are varied through the optimisation, and is an -dimensional vector of objective functions. The design vector has upper and lower bounds, and respectively, which help to not only reduce the design space and computational time but consider more realistic design variables. In this notation, and are the numbers of equality and inequality constraints, respectively. In the situation where has competing components, there is no unique solution, and therefore the multi-objective solution will be found on the Pareto optimal set(Pike-Burke, 2019, Karimi et al., 2017). The frontier presents a set of optimal solutions, moving along the front to another optimal solution, will improve one objective but worsen another, all points on this frontier can be considered as solutions to the multi-objective optimisation problem (Pike-Burke, 2019, Karimi et al., 2017). This can then introduce preference from the user, selecting overall the best solution for their needs.
3.2. Overview
An overview of the relevant literature considered within this work can be found in Table 7. This contains a breakdown of the support structure, wind turbineand systems considered. Details of the domain analysis technique, objectives, constraints, design variables and optimisation algorithms are also provided as well as details of the software utilised in each of the works.
3.2.1. Literature overview
The paper by Clauss and Birk (1996) was one of the first which explored the optimisation of offshore Oil and Gas (O&G) platform geometries. The main aim of this work was to create an optimisation tool which could handle any platform geometry in order to reduce cost and maintain good seakeeping performance. The methodology was not described in detail in this work, making it difficult to compare some aspects of their model. Birk and Clauss (2008)follow on from Clauss and Birk (1996) however, in this work, experimental validation was carried out to prove that the hydrodynamic analysis carried out in WAMIT was accurate for the non-traditional hull shapes. A major focus in this work was the automated shape generation of the hull, which was modified to include a moonpool. Since the early work of Clauss and Birk (1996) and Birk and Clauss (2008) was for offshore O&G platforms, no considerations for the wind turbine were included in either optimisation. Similarly, mooring lines were also neglected. Unlike Clauss and Birk (1996) and Birk and Clauss (2008), Wayman (2006) produced the first work to perform an optimisation of the SPAR, Tension Leg Platform (TLP), and barge platform geometry for a 5 MW wind turbine. This work also considered the optimisation of the mooring lines, however, this was carried out in a separate optimisation. Sclavounos et al. (2008) focuses on the performance of the turbine, the weight, and the mooring line tension to find the optimal of the three platform classes for varying water depth.
Fylling and Berthelsen (2011) was the first to create an optimisation tool (WINDOPT) for SPAR platforms, including the mooring and power cable within the optimisation, determining how these aspects affect the overall shape of the platform when minimising cost and maintaining performance. Nordstrom et al. (2013) in 2013 created a similar tool but for the PelaStar TLP. This tool returns a set of optimal particulars and scantlings that represent the platform with the lowest cost of energy. The platform is then verified against standards. Similarly, Myhr and Nygaard (2012) focus on optimising the layout of the Tension Leg Buoy (TLB) and its mooring lines to reduce costs while considering the loads acting on the structure, which can cause excessive loading on the anchors. Myhr and Nygaard (2012) approach the TLB in a different manner, considering a space frame to try and reduce loads, rather than other works which consider a tubular floater. Like Wayman (2006), Myhr and Nygaard (2012) perform optimisations of the platform and mooring lines separately in the time domain and the frequency domain, respectively. Similar to Myhr and Nygaard (2012) and Fylling and Berthelsen (2011), (Ferri et al., 2022) focus on only the semi-submersible platform, while the work carried out in 2022 by Ferri and Marino (2022)improve on their previous work by including a detailed cost model and an AEPmodel. Ghigo et al. (2020) presents six concepts. However, the optimisation result is only provided for the SPAR and Hexafloat platforms. Similarly (Ferri and Marino, 2022, Ghigo et al., 2020) also have a cost and AEP model presenting an end output value for the Levelised Cost of Energy (LCoE) for each platform. Sandner et al. (2014) and, more recently, Hegseth et al. (2020) also integrate multiple systems, with a strong focus on optimising the control system for three different SPAR platforms. Sandner et al. (2014) carry out the optimisation of three different SPAR geometries finding the most optimal controller gains to maximise power and reduce tower bending moment and inherently the nacelle acceleration, like a large percentage of other works seen in Section 3.3.
Hall et al. (2013) is one of the leading authors in this field, having published multiple articles. The work carried out in 2013 details an optimisation framework that includes the three main platform typologies, which can consider a wide range of existing and feasible non-existent platforms. Karimi et al. (2017) follows a very similar process to Hall et al. (2013) considering the three main platform stability classes, SPAR, TLP, and semi-submersible for a MW wind turbine. This work resembles that of Hall et al. (2013) focuses on trade-offs between cost and performance. Hall et al. (2014) has a different approach to all other papers considering the hydrodynamic properties to express the support structure rather than making prior assumptions about the geometry with traditional geometrical design variables. This method removes the geometrical constraints and widens the design space. This work uses six generic support structure designs, which allows the hydrodynamic coefficientcalculated to be compared to each support structure to determine their similarity.
Gilloteaux and Bozonnet (2014) do not carry out an optimisation as such, but it is the beginning of an optimisation process, a cylindrical body is modelled, and the hydrodynamics are assessed. From this assessment, four changes are made to the platform by adding one heave plate, two heave plates with different aspect ratio, and finally, three heave plates and active ballast. In essence, this is an optimisation that is not automated and over a smaller design space. Lemmer et al. (2020) also do not carry out an optimisation, it does however explore three semi-submersible designs with varying drafts to find the best solution.
Initial work carried out by Leimeister et al. (2019) uses an optimisation approach to determine a SPAR geometry for a 7.5 MW turbine based on the MW turbine rather than using traditional up scaling methods, ensuring the platform is still stable. Leimeister et al., 2020, Leimeister et al., 2021 focus on implementing the optimisation of SPAR platforms into the Modelica library for Wind Turbines (MoWiT) model for a wide range of design load cases, Leimeister et al. (2021) including considerations for the blade shape to optimise power generation without increasing thrust and load on the structure.
In 2020, Hegseth et al. (2020) was one of the very few groups of researchers to consider not only the platform, but the combined platform, tower, mooring, and control system in the optimisation process. This allows the coupling effects between the tower and the platform to be considered. Dou et al. (2020) and Lemmer et al. (2020) also consider the control system, the work by Dou et al. (2020) add an extension to the optimal control parameters of the work by Hegseth et al. (2020). The work by Hegseth et al. (2020) and Dou et al. (2020)draw focus on optimising the SPAR platform whereas Lemmer et al. (2020)focus on a semi-submersible with heave plates.
In later work by Hegseth et al. (2021) the tower and SPAR were optimised to host a MW wind turbine considering environmental effects, as well as the trade-off between CAPEX and OPEX based on fracture mechanics and updating reliability through inspection. Similarly, Leimeister and Kolios (2021) use a reliability approach for platform optimisation; By doing so, this addresses the issues of lack of standardisation, design standards, and over-engineered platform shapes. Bracco and Oberti (2022) also addresses design standards but instead focuses on optimising four main platform prototypes, considering the hydrostatics of each meet DNV design standards.
Benifla and Adam (2022) present a different platform typology, called Universal Buoyancy Body (UBB). Rather than using traditional stiffening methods, this platform has an inner and outer ‘pipe’ to strengthen the structure. Fig. 6 shows the structures’ geometry. It is predicted that this design will help reduce costs, by avoiding longer manufacturing times and complexities related to stiffeners. It is also expected that it could work in place of any cylindrical body in any of the three main platform typologies.
Fig. 3 highlights the platforms that have been worked on the most and how many papers include the three stability classes in their work. The majority of the research carried out has only considered a SPAR substructure. The reason for this is expected to be due to their simplicity for modelling purposes and the utilisation of a SPAR support structure at the Hywind site for a number of years. However, a large number of papers also considered all three platforms in their optimisation.
 Fig. 3. Platforms optimised within literature.
3.2.2. Turbine size
An improvement in Hegseth et al. (2020) compared to other work was the use of the MW DTU wind turbine, compared to other work that only used the MW NREL turbine (Hall et al., 2013, Hall et al., 2014, Karimi et al., 2017, Leimeister and Kolios, 2021, Leimeister et al., 2021, Leimeister et al., 2020, Sclavounos et al., 2008, Fylling and Berthelsen, 2011, Bracco and Oberti, 2022). Some of these papers, particularly (Bracco and Oberti, 2022, Leimeister et al., 2021, Leimeister et al., 2020, Leimeister and Kolios, 2021) were published in the last two years and still only use the smaller MW wind turbine, making it difficult to compare with current industry turbines, and even more difficult for future floating wind farms with an expected turbine capacity of upwards of 15 MW (Global Wind Energy Council, 2021). Similarly to Hegseth et al. (2020) and Dou et al. (2020), Ghigo et al. (2020) carry out an optimisation for the MW as well the MW and wind turbines for six floating platform concepts allowing for a comparison between technologies. Dou et al. (2020), Lemmer et al. (2020) and Ferri et al. (2022) also recognised the need to use a larger turbine by optimising the SPAR platform and the semi-submersible platform, respectively, for the MW DTU turbine, while both consider the mooring system. Pollini et al. (2021)are the only researchers who use the MW wind turbine in their optimisation with a focus on the optimisation of the mooring system and the support structure of a SPAR in a very fast process that takes only a few minutes. This is a key tool for quickly analysing and comparing future sites given the drive in the industry to draw out the maximum power, using bigger turbines (Global Wind Energy Council, 2021). Pollini et al. (2021) are the most relevant in terms of turbine size since the industry is expanding so rapidly with the most powerful turbine prototype rated MW already installed (General Electric, 2022). Fig. 4below shows visually how little work has been done on any turbine greater than MW.
 Fig. 4. Wind turbine power capacity used in existing literature.
3.3. Objective functions
An overall summary of the type of objectives used in the literature can be seen in Fig. 5.
Fig. 5 highlights that overall cost is the most predominant objective followed by the response. Cost is expected to be the main objective in the majority of engineering work and floating offshore wind is no different. The ability to find the cheapest yet feasible design option is crucial to help drive down the cost and, maintain high energy yield allowing FOW to be more competitive with other energy sources. In a lot of cases, there are conflicting objectives within the literature. The cost objective is used in work by Sclavounos et al., 2008, Fylling and Berthelsen, 2011, Myhr and Nygaard, 2012, Hall et al., 2013, Karimi et al., 2017, Lemmer et al., 2020, Lemmer et al., 2017, Benveniste et al., 2016, Dou et al., 2020, Hegseth et al., 2020, Hegseth et al., 2021, Pollini et al., 2021, Hall et al., 2014, Leimeister and Kolios, 2021, Wayman, 2006, Birk and Clauss, 2008, Ghigo et al., 2020, Leimeister et al., 2021, Leimeister et al., 2020, Pillai et al., 2018, Zhou et al., 2021 and Ferri and Marino (2022). The platform response was used as an objective in Sclavounos et al., 2008, Hall et al., 2013, Karimi et al., 2017, Ferri et al., 2022, Ferri and Marino, 2022, Hall et al., 2014, Leimeister et al., 2021, Clauss and Birk, 1996, Wayman, 2006, Sandner et al., 2014, Leimeister et al., 2019, Gilloteaux and Bozonnet, 2014, Birk and Clauss, 2008, Ghigo et al., 2020, Leimeister et al., 2021, Leimeister et al., 2020 and Pillai et al. (2018). The power production (Hegseth et al., 2020, Sandner et al., 2014), mooring (Sclavounos et al., 2008, Myhr and Nygaard, 2012, Brommundt et al., 2012) and tower systems (Lemmer et al., 2017, Benveniste et al., 2016) were considered less frequently in the objective function.
 Fig. 5. Type of objectives used in the literature.
3.3.1. Cost objective
Fylling and Berthelsen (2011) has one of the most adopted objectives, aiming to minimise the cost of the platform, of the mooring lines, and of the power cable. Similarly, in Karimi et al. (2017) the objective is to minimise the cost of the platform and the mooring system. The main objective in Myhr and Nygaard (2012) is to try and reduce the loading on the structure, which in turn will help reduce structural and station keeping system maintenance costs.
Bracco and Oberti (2022) and Ghigo et al. (2020) focus purely on minimising the material cost of the different platforms. Dou et al. (2020), Benifla and Adam (2022) and Pollini et al. (2021) use platform mass and mooring line minimisation as the objective. Hegseth et al. (2021) share the same objective as the above articles to minimise cost, in their case for the platform and tower. Wayman (2006) sets the objective to minimise the surface area of the cylinder, by doing so the volume and therefore the mass of steel required will be reduced, leading to a reduction in material cost. Sclavounos et al. (2008)consider the weight of the platform and the dynamic tension of the mooring line to find the optimal platform. This paper highlights that a reduction in weight will lead to a reduction in platform cost. This is consistent within all of the literature considered. Like in many other papers presented, Hegseth et al. (2020) consider the reduction in cost as a sub-objective along with the power quality of the turbine expressed as the rotor speed standard deviation. Both parameters are combined into one main objective function. Each sub-objective is given a weighting, which combined will equal one. The weighting of each is varied to determine the importance of each sub-objective. Hall et al. (2013) and Karimi et al. (2017), share the same multi-objectives: to minimise cost and nacelle acceleration, similarly to Hegseth et al. (2020) weightings are added to each sub-objective.
3.3.2. Motion objectives
The nacelle acceleration is the other competing objective in Karimi et al. (2017)and Hall et al. (2013) with the goal to minimise this parameter due to the platform’s pitch and surge motions. The purpose of this is to avoid excessive loads or higher fatigue damages on the blades and on the drive train, leading to a decreased system life span.
Both Hall et al., 2013, Karimi et al., 2017, Sclavounos et al., 2008 and Hall et al. (2014) only consider the nacelle acceleration in the objective function. It is assumed that Hall et al. (2014) focus on this single objective function due to the use of hydrodynamic properties to determine the geometry. The rationale given is that it would be difficult to set cost as the objective when geometric values such as length, thickness, and diameter are not available in the optimisation process.
Leimeister and Kolios, 2021, Leimeister et al., 2019 have objectives to minimise the horizontal displacements (i.e., surge, sway, and yaw) of the system, due to restrictions on the power cable motion. The overall goal of the work carried out by Leimeister and Kolios (2021) is to find the most reliable structure design. This has been done by considering the limit state of the bending stress at the tower base and the tensional stress of each mooring line, which are linked to the platform dynamic response to the metocean conditions, and hence also linked in turn to the platform geometry. Leimeister et al., 2021, Leimeister et al., 2020 objectives were to minimise the angle of inclination, reduce nacelle acceleration, and minimise translational motion, with the overall objective of reducing mass and cost. The reason for these objectives was based on the fact that the OC3 SPAR considered in their work has very high safety factors.
Work by Clauss and Birk (1996) for O&G platforms aimed to minimise the double amplitude of various forces and motions to stop disruption of platform operations. Similarly, Birk and Clauss (2008) had the objective to reduce the double amplitude of the heave motion along with the heave resonance. This can be done by increasing the draft of the platform and reducing the waterplane area, the motions will also be decreased. However, this is expected to also have a knock-on effect increasing cost of construction and installation, along with difficulty to handle this geometry which is not considered in the optimisation process. Both pieces of work by Clauss and Birk (1996) and Birk and Clauss (2008) are not for floating offshore wind however are still important and valuable when determining which platform is most suitable to meet a specific objective. Ferri et al. (2022) had the objective to minimise the amplitudes of the surge, heave, and pitch Response Amplitude Operator (RAO) at their respective eigenfrequencies. More recent work by Ferri and Marino (2022) have slightly different objectives, aiming to reduce the fatigue damage in certain load cases, maximum stress on the tower, and overall cost. These objectives are hoped to extend the service life and reduce the LCoE.
As mentioned earlier, Gilloteaux and Bozonnet (2014) and Lemmer et al. (2020)do not carry out optimisations however, similar to most other work, the objective within Gilloteaux and Bozonnet (2014) is to maintain stability. Whereas the objective in Lemmer et al. (2020) is to maximise power, by tuning the controller gains and minimise nacelle acceleration and cost.
3.4. Constraints
In order to ensure the optimisation results are within the realms of reality, it is important that constraints are added to the process. The most common constraints added within the literature are nacelle acceleration, platform motion, design variables, stability, mooring and structural. All of which are discussed within this section.
3.4.1. Cost constraints
Cost is one of the main drivers within all industries, and it has been made clear that floating offshore wind is no exception; for this reason, Hall et al. (2013)adopted a cap of million (2013 USD) on the support structure. This constraint was only seen three times in the literature, and the purpose of the constraint is unknown. It is speculated by the author that its purpose is to remove economically unfeasible design solutions. Karimi et al. (2017) has the same constraint on cost but includes additional constraints on performance, and design variables, these can be seen below in Table 7. Ferri and Marino (2022)apply a constraint on the cost of €8.15 Million (2022 EUR) and the tower bending moment, the purpose of this constraint is to avoid contradictory results with respect to the ultimate load state optimisation.
All other work considered in this review does not include a cost constraint, but Fylling and Berthelsen, 2011, Karimi et al., 2017, Bracco and Oberti, 2022, Ghigo et al., 2020, Hegseth et al., 2020, Hegseth et al., 2021, Dou et al., 2020, Benifla and Adam, 2022, Pollini et al., 2021, Wayman, 2006 and Sclavounos et al. (2008)consider it as an objective in their work. Ferri et al. (2022) is the only study which imposes that the mass of the MW platform and mooring system should not be greater than the upscaled MW basis platforms and mooring system. The purpose of this constraint is to seek a cost reduction and avoid over-engineering.
3.4.2. Nacelle acceleration constraints
The nacelle constraints which were applied in the literature can be seen below in Table 1
Design Load Case (DLC) 1.1 is for normal power production at around rated wind speed, DLC 1.3 is for below, at, and above rated wind speed with an extreme turbulent model, and DLC is also below, at, and above rated wind speed in a severe sea state. Additionally in Leimeister et al. (2019) DLC was also considered which is parked operation in extreme wind model, and extreme sea state model both with 50 year recurrence period. Pollini et al. (2021) use DLC 1.2 for a wind turbine operating in normal conditions. Since Leimeister and Kolios, 2021, Leimeister et al., 2021, Leimeister et al., 2020, Leimeister et al., 2019 and Pollini et al. (2021) cover a larger range with more harsh operating conditions, the use of a more relaxed allowance on the maximum nacelle acceleration is understandable. Fylling and Berthelsen (2011) and Gilloteaux and Bozonnet (2014) both have a larger acceptable nacelle acceleration this is expected since it considers operational and survival load cases.
Table 1. The nacelle acceleration constraints applied within the current literature.
| Ref | Nacelle acceleration limit (m/s) | Operating condition |
|---|---|---|
| Karimi et al. (2017) | 1 | Below, at, and above rated wind speed, and normal wave operating conditions. |
| Leimeister and Kolios (2021), Leimeister et al. (2021), and Leimeister et al. (2020) | 1.962 | IEC standard 61400-3-1, Design load case (DLC) 1.1, 1.3 and |
| Leimeister et al. (2019) | 1.962 | IEC standard 61400-3-1, DLC 1.1, 1.3, and |
| Pollini et al. (2021) | 1.962 | IEC standard 61400-3-1, DLC 1.2 |
| Dou et al. (2020) | 2 | IEC standard 61400-3-1, DLC 1.2 |
| Fylling and Berthelsen (2011) | 2.6 | Operational and survival load cases |
| Gilloteaux and Bozonnet (2014) | 5 | Normal operating condition and survival condition |
A number of papers consider the nacelle acceleration as a constraint since it is expected that it can cause damage too equipment, create large platform motions, is thought to reduce the lifetime, induce higher flap wise bending moments, reduce turbine performance and hence power production. It has however been argued by Nejad et al. (2019) that the nacelle acceleration is not correlated to the drive train response and does not affect the power production, so long as the pitch controller remains operational. It was also predicted by Nejad et al. (2019) that the main bearing fatigue is also not affected by the nacelle acceleration. These findings cause the author to question the use of this constraint in the optimisation framework. It would be interesting to see if the nacelle acceleration affects other parts of the turbines fatigue life, such as the tower, support structure and mooring lines. The work by Nejad et al. (2019) only considers a MW turbine, since the tower height increases with turbine since the author wonders if there is still no affect on the drive train and the main bearing due to the acceleration of the nacelle.
3.4.3. Motion constraints
When considering motion constraints the simplest is to impose a constraint on the static pitch. This can easily be improved by considering both static and dynamic pitch for a number of operational cases. This constraint is important because after a certain angle the turbine would become unstable but it would also allow the reduction in power to be considered. Other constraint on other degrees of freedom can also be considered to ensure the platform is not moving more than acceptable limit ensuring the mooring lines and dynamic cable are not under severe loading. The final motion constraint generally considered is the natural period/frequency, which helps avoid resonance and potential failures of the system as a whole. In the extensive work by Leimeister and Kolios, 2021, Leimeister et al., 2021, Leimeister et al., 2020, Leimeister et al., 2019 to achieve the required wind turbine performance, total inclination angle of the floating structure must be less than 10 degrees. Both consider a number of normal operational conditions and extreme events. Karimi et al. (2017) and Sclavounos et al. (2008) both consider the static pitch angle should be less than 10 degrees, both consider normal operational conditions only. Work completed by Ghigo et al., 2020, Ferri et al., 2022 and Ferri and Marino (2022) impose stricter constraints, requiring the maximum static pitch angle to be less than 5 degrees, for both normal and extreme conditions. This choice is probably due to the fact that the platform dynamic response is neglected in their work. Pollini et al. (2021) require the static pitch and surge to be less than 8 degrees and 50 m, respectively. Dou et al. (2020) also apply a maximum static surge motion of 50 m to the platform. When considering only the static pitch having a lower constraint seems like a fair assumption given there is no environmental loading considered.
It is beneficial to consider both dynamic and static pitch as a summation since the static position will be the equilibrium for the system. Combining the static position with the dynamic displacement helps to simulate the real life event or potential phenomenon more accurately. Gilloteaux and Bozonnet (2014)consider the summation of static and dynamic pitch should be less than 10 degrees, whereas Dou et al. (2020) consider dynamic and static pitch individually, imposing that each should be less than 10 degrees. The work by Gilloteaux and Bozonnet (2014) deal with extreme and normal operating conditions, whereas Dou et al. (2020) only consider normal operating conditions, making their constraints more relaxed in comparison to Gilloteaux and Bozonnet (2014). Hall et al. (2013) also include a similar constraint, the static pitch angle in this work has a 10 degree limit and separately the dynamic pitch plus the standard deviation of the pitch must be less than 10 degrees.
Hall et al. (2013), similar to Dou et al. (2020), only examine normal operating conditions, making the consideration of a degree limit seem fair. Fylling and Berthelsen (2011) apply a constraint on the dynamic pitch of the platform, requiring the inclination of the tower to be less than 9 degrees, for both normal and extreme conditions. Hegseth et al., 2020, Hegseth et al., 2021 apply a 15 degree constraint on the combined static and dynamic pitch angle in the 50-year survival condition. Since this is for a survival condition it makes sense for it to be higher than other literature.
A more flexible approach which is considered in the following paragraph, considers the motion as a percentage of water depth, since a displacement may seem large dependent on how deep or shallow the water depth is. Leimeister and Kolios, 2021, Leimeister et al., 2019 constrain the mean translational motion to not exceed 20% of the water depth in normal and extreme conditions, whereas Hegseth et al. (2020) set a maximum constraint of 32 m on the offset in the 50-year condition. Applying a similar constraint to Hegseth et al. (2020), Ferri et al., 2022, Ferri and Marino, 2022 state that the admissible platform offset to water depth ratio must be less than 0.15 (i.e. 15% of the water depth). Both normal and extreme load cases were considered in Ferri et al., 2022, Ferri and Marino, 2022. Considering this constraint as a percentage of water depth is a more flexible approach, making it suitable for multiple different sites.
Both the heave and pitch periods are required to be within a given range in Fylling and Berthelsen (2011), to avoid resonance with typical wave load periods. Building on the work in Fylling and Berthelsen (2011), Dou et al. (2020)also include these constraints along with the maximum surge frequency. It was however noted that Birk and Clauss (2008) only consider the heave period. Hegseth et al. (2021) also only consider the heave period applying a lower limit of 25 s to avoid resonance with the wave period. Lemmer et al. (2020) only considered a constraint on the pitch natural frequency, the reason for this is the strong focus on the effect of the controller, since it is related to reducing torque and thrust, it will also effect the motion of the platform in the pitch direction. Similarly Pollini et al. (2021) also apply constraints to the eigenvalues, however in this case three Degrees of Freedom (DOF) are considered.
3.4.4. Design variables constraints
It is common practice to include constraints on design variables, Bracco and Oberti (2022) along with Hall et al., 2013, Karimi et al., 2017, Leimeister and Kolios, 2021, Clauss and Birk, 1996, Sclavounos et al., 2008, Leimeister et al., 2021, Leimeister et al., 2020, Hegseth et al., 2020, Birk and Clauss, 2008, Ghigo et al., 2020, Leimeister et al., 2019, Lemmer et al., 2020, Pollini et al., 2021, Ferri et al., 2022 and Hegseth et al. (2020) include such constraints on the design variables. This removes unrealistic designs and creates a more focused design space. Birk and Clauss (2008) highlight that the purpose of the diameter constraints is to ensure the platform can be transported and removes restrictions during the construction phase. Dou et al. (2020) only apply an allowable range for the mooring line length, which would probably need to change for each site investigated since water depth varies. Perhaps taking into account the maximum mooring line length as a % of water depth would make the work more universal for different site conditions. This is also the only work to consider the maximum percentage of the suspended line.
The constraints imposed on the design are directly linked to the individual components considered in the work. For example Hegseth et al. (2021) include the tower in their optimisation and therefore, a constraint is set to ensure that the bottom of the tower and the top of the SPAR have the same diameter and thickness. The hull taper angle is also limited to a maximum value of 10 degrees to avoid shapes where the physics is not captured correctly (Hegseth et al., 2021). Since Birk and Clauss (2008) proved with experimentation that WAMIT can correctly capture hydrodynamics of strange shapes, perhaps this constraint is not required for this purpose but maybe for the manufacturability of the structure.
As discussed, in Section 3, Hall et al. (2014) takes a different approach than other works reviewed, and therefore also takes a unique approach in terms of variable constraints. As explained before Hall et al. (2014) consider hydrodynamic performance coefficients rather than traditional geometrical values to describe the platform geometry. For this reason, a collection of unique geometrically-defined platforms are used as basis designs, from which the hydrodynamic performance coefficients can be linearly combined to approximate the characteristics of any platform in the design space. Constraints are applied to the performance coefficient to a range between zero and one, and the summation of the variables must equal one. The reason for a range of zero to one is the coefficients of each basic design are scaled and superimposed to find the new coefficients for each design. If the coefficients are summed equal to one then the platform geometry is known, however, if it equals zero then the optimisation tool has no bearing on the platform configuration This work does not explicitly state the constraints they used, however, it is noted that the constraints are on the hydrodynamic design properties. This suggests that there are bounds on parameters such as stiffness, damping, and added mass matrixetc.
3.4.5. Static stability constraints
Bracco and Oberti (2022) differ slightly from other work, as the constraints are related to the DNV design standards DNVGL-ST-0119 for the free-float condition, minimum freeboard, and the DNV-OS-C301 standard for the maximum intact inclination angle under normal and survival conditions. These constraints are good because, the designed platform will need to pass this criteria in order to get certification. Sclavounos et al. (2008) consider a minimum restoring coefficient to ensure adequate restoring under the towing condition and operation, similar to the free float constraint in Bracco and Oberti (2022). Clauss and Birk (1996) have constraints on floating stability of the O&G platform, but do not explicitly state what they are. Fylling and Berthelsen (2011)apply a limit on the SPAR draft as the only constrained design variable, leaving a much wider design space. Work in Gilloteaux and Bozonnet, 2014, Ghigo et al., 2020 also constrains the draft but additionally sets a minimum value on the metacentric height, Birk and Clauss (2008) also constrain the metacentric height. Additionally, Ghigo et al. (2020) place a minimum freeboard requirement which would be something design standards would require like Bracco and Oberti (2022) inclusion of DNV standards. In Dou et al. (2020) and Pollini et al. (2021) a simple constraint related to hydrostatics was used to ensure that the centre of buoyancy is higher than the centre of mass. Benifla and Adam (2022) require the buoyancy to be above a particular value, depending on the type of platform.
It is unclear what constraints were actually set in Wayman (2006), however from the work it can be seen that for the SPAR, Trifloater, and Barge there needs to be a minimum restoring coefficient for the pitch degree of freedom, since both the SPAR, Trifloater, and barge should be able to maintain stability without mooring lines. These listed platforms are also required to have a realistic draft in order to remain below the waterline and in the SPARs case provide sufficient restoration. Wayman (2006) require the TLP to remain below the water line to reduce structural loading.
A slightly different perspective was applied in Sclavounos et al. (2008), where a constraint was added to the elevation of the free surface, ensuring that it does not exceed the draft of the cylinder when it is heeled, ensuring the support structures remain submerged. This constraint could also be useful to ensure that the minimum freeboard requirement is met.
3.4.6. Mooring line constraints
Mooring line constraints were also considered in Karimi et al. (2017) where they require that the tension remains relatively constant for taut mooring lines, the standard deviation of the tension in the mooring line, cannot be greater than a third of the overall tension. Hall et al. (2013) also use the same constraint for the mooring lines. The mooring constraint in Wayman (2006) is related to the mooring line tension, they must provide sufficient restoring in the surge, and the tension of the windward tether must never exceed the maximum allowable tension, and the leeward tension cannot fall below the minimum allowable tension. Myhr and Nygaard (2012) apply mooring line constraints, which are considered by a penalty function on the cost function. Constraints were also applied to the natural periods for the optimisation of the mooring lines, to avoid natural periods of the rotor etc. Within Myhr and Nygaard (2012), as previously explained, the mooring and structure optimisation are in two separate domains. The constraints for the mooring line optimisation, in the time domain, are the following two: minimum tension required in a storm event, and the maximum axial stress in the space frame. Both Sclavounos et al. (2008) and Hegseth et al. (2020) apply similar constraints to the mooring line, stating that the dynamic line tension cannot exceed the breaking load of the mooring line, with Sclavounos et al. (2008) applying a safety factor of two. Pollini et al. (2021) set a constraint on the maximum vertical force to which the fairlead is exposed. They also require the mooring line length to fall within a prescribed range. This range will need to change depending on the depth of the water at the site. Fylling and Berthelsen (2011) have more constraints on the mooring line which are: maximum and minimum tension on the mooring line segment, minimum fatigue life, and maximum slope angle at the anchor. Constraints are also applied to the power cable, maximum tension, minimum cable curvature radius, maximum horizontal offset, and minimum static horizontal pretension limit. Ferri et al. (2022) apply cable length constraints, to ensure the triangular shape and the minimum amount of cable on the sea bed.
3.4.7. Structural constraints
The inclusion of structural constraints in limited within the literature, only appearing in the work of Hegseth et al., 2020, Hegseth et al., 2021 and Leimeister and Kolios (2021). Hegseth et al. (2020) focus on the constraints related to fatigue and the ultimate limit state for the SPAR and the tower, Table 7 details these constraints applied. Similarly, Hegseth et al. (2021) impose that the support structure fatigue damage must be less than a given value for the design fatigue factors. Other work which considers a structural constraint is Benifla and Adam (2022), placing a constraint on the maximum allowable stressover the complete platform structure.
Leimeister and Kolios (2021) have two main constraints related to the bending stress at the base of the tower and the tensional stress of the mooring line. These constraints ensure the tower base and mooring lines do not exceed the ultimate values (Leimeister and Kolios, 2021).
3.5. Design variables and platform modelling
3.5.1. Platform design variables
In Karimi et al. (2017) and Hall et al. (2013), a parameterisation scheme, able to describe the three main platform configurations (i.e., barge/semi-submersible, SPAR, and TLP) is used, consisting of nine design variables. Sclavounos et al. (2008) use five design variables, two of which describe the TLP, SPAR, and Barge platforms and three to describe the station keeping system. Authors of Hall et al. (2014) use a slightly different parameterisation scheme: rather than using values to describe the geometry, such as diameter or length, hydrodynamic properties are used.
Clauss and Birk (1996) firstly use a parameter which determines which O&G platform type is considered: gravity base, TLP, caisson semi-submersible, or semi-submersible. Then, for each different platform, different design variables are adopted. In the work by Birk and Clauss (2008), the SPAR geometry is described by four cylindrical sections which make up the full platform geometry. In order to express the SPAR geometry, the ratio of the two cross sectional areas where two sections join together, the length of each cylindrical section, and the ratio of each sections length compared to the next section and the total draft are used.
Bracco and Oberti (2022) consider four different platform types: SPAR, Windfloat Pelastar and Windstar. However, their work does not use a parameterisation scheme, and each support structure geometry has its own design variables. For example, the SPAR is expressed by the diameter, height, seawater height and ballast height, whereas the Pelastar is described by column height, diameter of hull and column, hull depth, arm radius, and concrete volume. Similarly to Bracco and Oberti (2022), Ghigo et al. (2020) present the SPAR and Hexafloat separately with their own design variables. This method limits the design space and removes the ability to explore other geometries and concepts, which would be useful in the initial design stages, particularly so for a less mature industry. Wayman (2006) optimise the barge and SPAR together because both are represented as cylindrical bodies, and the TLP and Trifloater are optimised separately with their own design variables. Leimeister and Kolios, 2021, Leimeister et al., 2019 only explore one platform type, the SPAR, describing it with three design variables. Dou et al. (2020) also only consider the SPAR, but six design variables are used, three to identify the SPAR geometry, two for defining the station keeping system, and one for the export cable length. This is a similar approach to Pollini et al. (2021), focusing on the SPAR, and using six design variables, three for the SPAR geometry, and three for the station keeping system. Myhr and Nygaard (2012), similarly to the above, consider only one type of platform, a TLB. This work, however, adopts a ten variables design vector, four of which are related to the station keeping system, and the rest dedicated to identify the platform geometry. Ferri et al., 2022, Ferri and Marino, 2022 and Lemmer et al. (2020) focus only on the semi-submersible platform configuration, Ferri et al. (2022) describe the hull geometry with five design variables, and its mooring system with two design variables. None of these design variables describes the geometry of the platform’s bracings, whereas Lemmer et al. (2020) uses nine variables to describe the platform geometry, which does include the bracing. A parameter included in this work that has been rarely seen in the literature other than (Hegseth et al., 2020, Hegseth et al., 2021, Zhou et al., 2021) is the thickness of the steel. This is rarely seen in the literature due to the lack of structural considerations in the optimisation frameworks reviewed.
Fylling and Berthelsen (2011) include slightly more variables for the SPAR body compared to the aforementioned work, the main difference in this work is the SPAR is split into a number of cylinders, sometimes referred to as parts or segments. The thickness and diameter of the bottom plate are also considered, which can act as a damping plate by increasing the vertical drag force and added mass. This gives a total of five variables to describe the hull geometry, two of these variables, the length and diameter, are vectors describing how the geometry changes along the length of the SPAR. Hegseth et al. (2020) are one of the few groups of researchers who include in the design variables the geometry of the ring stiffeners inside the hull (each one described by five design variables, i.e. the thickness and length of the web and the flange, and the distance between the stiffeners). Since, in Hegseth et al. (2020), the tower does not include stiffeners, a higher density of steel is used to account for additional mass related to the stiffeners. The geometry of the SPAR hull and tower shells are expressed by vectors for the diameter and the thickness. Similar to Fylling and Berthelsen (2011), Hegseth et al. (2020) consider both the tower and the SPAR as a number of truncated cones rather than cylindrical segments creating a ‘smoother’ geometry. Additionally, the SPAR hull considers the overall length as a variable, unlike the tower, which is kept constant to ensure the correct hub height. Hegseth et al. (2020), unlike the approaches in the other works, include variables for the controllers that allow the proportional and integral gain to be optimised to get the maximum energy output. It can be clearly identified that Hegseth et al. (2020) consider the largest number of variables, totalling 110. A method to reduce this number was to consider a B-spline for the ring-stiffener parameters, which uses a pre-defined number of control points to produce a smooth distribution of parameters. Overall this reduced the variables to 80. The work carried out in 2021 by Hegseth et al. (2021) uses the same constraints minus the scantling and controller design variables.
3.5.2. Platform geometry
Work by Benifla and Adam (2022) presents a support structure called Universal Buoyancy Body (UBB) aimed at reducing production cost by serialising the fabrication procedure using standard components. In Fig. 6, a visual representation is reported.
It is expected that because it is expressed with cylindrical bodies joined by bracings it can represent many different platform typologies since in general terms most support structures comprised of cylinders. Unlike the work of Hegseth et al. (2020), which considers the scantling, Benifla and Adam (2022)use an inner and outer cylinder which can both be expressed by length, thickness, and radius. It is hoped that this design will reduce the manufacturing cost by reducing the material and production costs since traditional stiffeners are not used. The strength of the structure will be provided by using thicker plates to create the inner and outer cylinders. The author does however wonder if this research has considered that by increasing the thickness of the steel plates, the difficulty to form plates into cylinders increases and often more sections are required to make the cylinder to avoid difficulties in rolling. As the thickness of plates increase the number of v-grooves required also increases for the welding process, causing the weld cost to increase. When considering this it would be interesting to draw a comparison on the cost of a traditional stiffening structure compared to this new proposed structure.
 Fig. 6. Universal Buoyancy Body from Benifla and Adam (2022).
Authors of Karimi et al., 2017, Hall et al., 2013, Dou et al., 2020, Pollini et al., 2021, Ferri et al., 2022, Ferri and Marino, 2022, Wayman, 2006 and Benifla and Adam (2022) present the platforms in their work using right circular (i.e., straight sided) cylinders, therefore not considering any changes in radius along the vertical direction in the single cylinder (although different cylinders may have different radii). Authors of Hall et al. (2014) and Bracco and Oberti (2022)also use multiple cylinders to describe the geometry of the different platforms. Similarly, Ghigo et al. (2020) use a right circular cylinder to describe the SPAR hull, and a number of the same elements to describe the Hexafloat platform. The cylinders are not split into a number of smaller cylinder segments, and they can only change the overall diameter and length during the optimisation process. The work presented in Sclavounos et al. (2008) only considers singular, straight sided cylindrical bodies and does not include any additional appendages, such as bracing or legs, making the geometry simplified. The work by Leimeister et al., 2018, Leimeister et al., 2020, Leimeister et al., 2019 also present the platform in a simplistic manner, only modelling the complete vertical section of the SPAR: similarly to Karimi et al., 2017, Hall et al., 2013 and Hall et al. (2014) it does not consider the cylinders segmented into a number of smaller segments or changes in radius. A more advanced modelling approach was adopted by Fylling and Berthelsen (2011): the SPAR is divided into segments, where each segment can have a different radius. In a real scenario, it is more realistic to consider the support structure is constructed from multiple parts, since the platform would be made from a number of segments in order for it to be manufactured. It could, however, be argued in this case that it is less realistic since the radius of each cylinder is different, and it will be more difficult to manufacture. Clauss and Birk (1996) use horizontal cross sections which could be meshed together, allowing the radius to change vertically, giving a curved body unlike the stepped shape in Fylling and Berthelsen (2011). Hegseth et al., 2020, Hegseth et al., 2021, differently from the others, but similar to Clauss and Birk (1996), describe the platform and tower geometry with truncated cones rather than right circular cylinders. Birk and Clauss (2008)propose a parameterisation scheme for the SPAR, The SPAR body consists of four vertical-sided columns and three truncated cones to join the vertical columns. The radius of each column can have a different value hence the requirement for the truncated cones to join each section. Fig. 7 shows examples of the proposed SPAR support structure.
Myhr and Nygaard (2012) utilise a space-frame which differs from other work done in this area, see Fig. 8. There are four variables which change the geometry, the outer diameter of the lower cylinder, height of the space-frame, distance between column and turbine centre line and the outer diameter of the vertical column(s) in the space-frame. The purpose of using this geometry is by replacing the cylinders it is expected that the wave forces will be reduced a significant amount as well as reduce the fabrication costs.
 Fig. 7. SPAR support structure proposed in Birk and Clauss (2008).
 Fig. 8. Space-frame concept utilised in Myhr and Nygaard (2012).
3.5.3. Mooring line design variables
Fylling and Berthelsen (2011) identify the mooring lines’ and power cables’ geometry with the following variables: line direction, pretension, segment length, diameter, and net submerged weight. Sclavounos et al. (2008) use three variables to describe the mooring system, considering the angle between the free surface and the anchor, allowing the type of mooring system to be determined, i.e., taut or catenary. Hegseth et al. (2020) also model the mooring line, using the diameter of the line, the depth of the fairlead below the waterline, the total length of the line, and the horizontal distance between the fairlead and anchor. Since different platforms may require different mooring configurations, Karimi et al. (2017) and Hall et al. (2013) use one of the variables to identify which mooring arrangement is used.
3.6. Optimisation algorithms
This section focuses on the optimisation algorithms used within the current literature, these different techniques will be briefly explained, for further details on trends within see Younis and Dong (2010). Fig. 9 highlights the algorithms used graphically, where it can be easily identified that genetic algorithms are used the most. Authors of Benifla and Adam, 2022, Bracco and Oberti, 2022, Ferri et al., 2022, Leimeister et al., 2020, Leimeister et al., 2021, Ghigo et al., 2020, Birk and Clauss, 2008, Leimeister et al., 2019, Karimi et al., 2017, Hall et al., 2013 and Ferri and Marino (2022) all use GA optimisation techniques. Further information on genetic algorithms can be found here (Mitchell, 1998). The gradient-based methods used in Hegseth et al., 2020, Hall et al., 2014, Clauss and Birk, 1996, Pollini et al., 2021, Dou et al., 2020, Fylling and Berthelsen, 2011, Myhr and Nygaard, 2012 and Hegseth et al. (2021) make use of functions gradients to search for the optimal design, seeking out the ‘turning points’ of the objective function and constraints in a given design space to find the global maximum or minimum depending on the goal.
Several authors use a multi-objective Genetic Algorithm (GA) tool to find the optimal platform (Karimi et al., 2017, Ghigo et al., 2020, Bracco and Oberti, 2022, Ferri et al., 2022, Ferri and Marino, 2022, Benifla and Adam, 2022). Hall et al. (2013) use a cumulative multi-niching GA (CMN GA). Leimeister and Kolios, 2021, Leimeister et al., 2021, Leimeister et al., 2020 and Leimeister et al. (2019)use the Non-dominated sorting GA II (NSGA II) from Platypus. Clauss and Birk (1996) utilise a nonlinear programming algorithm. Similarly, Fylling and Berthelsen (2011) adopt a Non-Linear Programming technique, Quadratic Lagrangian (NLPQL) optimisation. Hall et al. (2014) also use a non-linear optimiser found in the MATLAB toolbox, ‘fminsearch’. Myhr and Nygaard (2012)apply a Bound Optimisation BY Quadratic Approximation (BOBYQA). Hegseth et al., 2020, Hegseth et al., 2021 use a gradient-based method (SNOPT) that uses sequential quadratic programming. Similar to Hegseth et al. (2020), Dou et al. (2020) also use a sequential quadratic programming (SQP) method. Birk and Clauss (2008) utilise a multi-objective evolutionary algorithm (MOEA).
 Fig. 9. Optimisation algorithms used within the literature.
Unlike other works, Pollini et al. (2021) use two optimisation techniques, the first for a global solution and the second for a localised optimisation. The first stage of optimisation uses SQP and the latter uses relaxation-induced neighbourhood search (RINS). Authors of Wayman (2006) and Sclavounos et al. (2008) do not state which optimisation algorithm is used.
3.7. Modelling and software utilised
A number of papers use frequency domain dynamic models, due to the smaller computational time to carry out the analysis (Karimi et al., 2017, Hall et al., 2013, Hall et al., 2014, Fylling and Berthelsen, 2011, Myhr and Nygaard, 2012, Sclavounos et al., 2008, Hegseth et al., 2020, Gilloteaux and Bozonnet, 2014, Birk and Clauss, 2008, Dou et al., 2020, Pollini et al., 2021, Ferri et al., 2022, Ferri and Marino, 2022, Hegseth et al., 2021, Wayman, 2006). Few other works use a time analysis domain (Leimeister and Kolios, 2021, Leimeister et al., 2021, Gilloteaux and Bozonnet, 2014, Ferri et al., 2022, Ferri and Marino, 2022, Lemmer et al., 2020). Some work included a time domain to verify the work carried out in the frequency domain Karimi et al., 2017, Myhr and Nygaard, 2012, Hegseth et al., 2020, Hegseth et al., 2021.
The effectiveness of an optimisation framework, and subsequent results, is dependent on the types of software available which are fit for purpose. Fig. 10highlights how dependent this research is on both WAMIT and FAST for hydrodynamic and aerodynamic analysis. For this reason, a large number of the existing literature use non-gradient-based methods for their optimisation. However, authors such as Hegseth et al. (2020) use gradient-based optimisations, since they use formulae from which gradients can be derived.
In the work by Karimi et al. (2017) the hydrodynamic properties of the platform was found using WAMIT1 which can then be combined with the equations of motions. Authors of Clauss and Birk, 1996, Hall et al., 2013, Sclavounos et al., 2008, Birk and Clauss, 2008 and Wayman (2006) followed a similar approach for hydrodynamic analysis. Hall et al. (2014) unlike Clauss and Birk, 1996, Hall et al., 2013, Karimi et al., 2017 and Sclavounos et al. (2008) do not use WAMIT to find the hydrodynamic properties of each platform geometry; instead, WAMIT is used to find the hydrodynamic properties of six base designs, which can then be used as a starting point for optimisation. Fylling and Berthelsen (2011) use WAMOF3 rather than WAMIT to obtain the hydrodynamic coefficients and from these the motion transfer functions. A different technique was proposed in Hegseth et al., 2020, Hegseth et al., 2021: rather than using a potential flow code (e.g. WAMIT), they adopt the MacCamy-Fuchs theory to determine hydrodynamic excitation loads, while the added mass was based on analytical 2D coefficients, the Radiation damping was neglected, viscous damping was computed using a stochastic linearisation of the drag term in Morison’s equation. Since this is a linear model, a time domain verification was carried out using SIMA.2
 Fig. 10. Additional software used within the optimisation frameworks.
Gilloteaux and Bozonnet (2014) utilise DIODORE3 software to find the hydrodynamic properties using the frequency domain, DeepLines4 is then used to model the platform and mooring lines in the environment in the time domain.
Both Dou et al. (2020) and Pollini et al. (2021) use the Quick Load Analysis of floating offshore wind turbines model (QuLaF) to determine the hydrodynamics of the platform, a model created by Pegalajar-Jurado et al. (2018). The only works which use ANSYS AQWA to find the hydrodynamic forces were (Ferri et al., 2022, Ferri and Marino, 2022, Lemmer et al., 2020), this model was also verified with WAMIT in Ferri et al. (2022).
Bracco and Oberti (2022) apply an in-house hydrostatic tool, Ghigo et al. (2020)and Lemmer et al. (2020) also use basic hydrostatic concepts to determine the stability of the platforms.
Several authors (Karimi et al., 2017, Hall et al., 2013, Hall et al., 2014; Sclavounos et al., 2008, Dou et al., 2020, Pollini et al., 2021, Ferri et al., 2022, Wayman, 2006, Ferri and Marino, 2022) use FAST, this allows the influence of the rotor aerodynamics and the wind turbine mass effect on the FOWT motions to be considered. It can be noted that some of the aerodynamic effects on platform motion cans also be considered by utilising a frequency domain approach without using FAST. Karimi et al. (2017) utilise FAST as verification in the time domain, which shows the variation in the surge, pitch, and nacelle acceleration of a TLP and a SPAR. Lemmer et al. (2020) applied a similar approach and used FAST as a verification tool for their Simplified Low Other Wind Turbine Model (SLOW) methodology.
In work by Karimi et al. (2017) and Hall et al., 2013, Hall et al., 2014 the mooring lines are modelled using a quasi-static mooring subroutine of FAST. Fylling and Berthelsen (2011) use MIMOSA to perform extreme conditions for fatigue analysis on the mooring lines. Finally, Sclavounos et al. (2008) utilise the LINES software to find the properties of the mooring system. Hegseth et al. (2020)utilise a dynamic frequency-domain model to find the tension in the line, considering it only has one Degree of Freedom (DOF) (Larsen and Sandvik, 1990)
Research carried out by Leimeister and Kolios, 2021, Leimeister et al., 2021, Leimeister et al., 2019 use MoWiT (Modelica library for Wind Turbines) to perform aero-hydro-servo-elastic analysis for the wind turbine, in the time domain. Similarly, Myhr and Nygaard (2012) also apply an aero-hydro-servo-elastic tool called 3DFLOAT and Hegseth et al., 2020, Hegseth et al., 2021combines structural and control parts to create a full aero-hydro-servo-elastic model.
Bracco and Oberti (2022) did not include any dynamic modelling and focused purely on the hydrostatics of the platform to assess the stability. Benifla and Adam (2022) also do not include any dynamic modelling; however, it does use Ansys SOLID186 to perform finite element analysis and FLEX5 to determine the loading on the platform.
Table 2. Summary of the reviewed works in Section 3.8, describing the support structure, tower structure, mooring line, anchor, cable, AEP, additional costs, optimisation related costs, LCoE, and relevant notes.