1. Introduction
N-glycans are irregular polymers of five monosaccharides—namely, mannose, galactose, fucose, sialic acid, and N-acetylglucosamine (GlcNAc)—that are attached to polypeptide structures, forming glycoproteins through a glycosidic linkage to the asparagine (Asn) side chain [1]. Glycosylation influences the physical and chemical properties of proteins, as well as their biological functions. N-glycoproteins exhibit great variety in their glycan part; an N-glycoprotein may have single or multiple N-glycosylation sites, and not all are necessarily glycosylated. N-glycans exhibit intra- and inter-protein variation: Different N-glycans may attach to different molecules of the same protein, and there is a wide spectrum of N-glycans attached to different proteins. About half of human blood plasma proteins are equipped with oligosaccharide chains (“glycans”) [2]. Protein glycosylation is controlled by genetic, epigenetic, and environmental factors [3], [4], [5]. Although the glycosylation pathway is biochemically well-studied [6], little is known about the networks of genes that regulate the cell- and tissue-specific regulation of these biochemical reactions in humans in vivo. There is more than just academic interest in the regulation of protein N-glycosylation, as the latter’s role is increasingly recognized in human health and disease [7], [8]. Glycans are considered to be potential therapeutic targets [9], [10], [11], an essential part of therapeutics [12], [13], [14], and biomarkers [15], [16], [17], making glycobiology a promising field for future clinical applications [18].
Similar to other “-omics,” an organism’s “glycome” consists of all the glycan structures synthesized by that organism [19]. Cells of different types synthesize a subset of the glycome, depending on their differentiation state and physiological environment. Here, we use the term “glycome” to denote a quantified repertoire of glycans that a cell or tissue produces under specified conditions of time, location, and environment. We also use the term “single-protein glycome” (e.g., the “immunoglobulin-G N-glycome”) to describe a quantified spectrum of glycans attached to a specific protein.
The combination of human glycomics and genomics offers a powerful “data-driven hypotheses” [20] approach for dissecting the complex human glycobiology in vivo in an agnostic manner [21]. Thus far, analysis of the N-glycosylation of thousands of samples is limited to a few types of available tissues and proteins. More specifically, until recently, large cohort studies of human N-glycosylation were limited to studies of the N-glycome of immunoglobulin G (IgG) and the glycome of blood plasma (the plasma N-glycome), where the latter refers to the spectrum of glycans attached to the blood plasma glycoproteins. Tens of thousands of samples have been characterized for these glycomes [22]. Recently, large-scale studies of the glycomes of other glycoproteins, such as transferrin (TF) [23], IgA [24], [25], and apolipoprotein CIII [26], have become possible, but the number of samples being investigated remains limited.
Thus far, studies on the genetic regulation of the populational variation of N-glycosylation—which require a large cohort of samples measured for both their glycomes and the genomes—have been limited to the analysis of plasma glycome, IgG, and TF N-glycosylation. These three glycomes make up a rather limited set, compared with the enormous multitude of glycomes of different tissues and glycoproteins; however, the study of these three glycomes allows for powerful analysis and generalization.
The purpose of this review is to complement and extend the summary and discussion of populational glycogenomics in the reviews in Refs. [21], [27]. More specifically, we provide a detailed summary of the results that have been obtained since the previous reviews were published. We summarize this new information and consider special cases of interest in light of new discoveries, focusing on possible mechanisms of action and biological targets of genetic variation that have been implicated in human protein N-glycosylation. For a detailed discussion of already-established heritability and associated loci, interested readers are referred to previous reviews and original works.
2. The N-glycosylation of IgG, TF, and the total plasma proteome
IgG is the key player of systemic humoral immunity. It is the most prevalent isotype found in the circulation and tissues. Due to its wide spectrum of activity, IgG is involved in multiple immune reactions, including complement activation, phagocytosis, and antibody-dependent cellular cytotoxicity (ADCC) [28], [29]. IgG is the most abundant glycoprotein in the human bloodstream, possibly contributing close to half of all total plasma N-glycans (Table 1 [2], [30], [31]). IgG consists of two biologically different regions: the antigen-binding fragment (Fab) and the crystallizable fragment (Fc). Both of these regions can be glycosylated. The Fc fragment of IgG harbors a conservative N-glycosylation site at the Asn297 position in the CH2 domain. Since IgG is a homodimer, each of the two heavy chains can be glycosylated at Asn297. IgG-linked N-glycans are either high-mannose or biantennary glycans, usually with core fucosylation, and may carry one or two galactose residuals with a possible extension of one or two sialic acids. It has been shown that Fc-linked N-glycosylation changes during pathological and physiological events and strongly affects the antibody inflammatory properties [32], [33], [34], [35], [36]. In contrast, little is known about Fab-linked N-glycosylation. N-glycans are known to occur on 15%–25% of IgG Fab fragments; they can influence antibody affinity and avidity for antigens, as well as IgG half-life [37].
Table 1. Average concentration and likely origin of major human blood plasma glycoproteins. Likely source tissue and cell type are inferred as the tissues known to secrete proteins in blood and with high expression of the protein in question. (More detailed information is provided in Table S1 in Appendix A.)
| Glycoprotein | Gene(s) | Tissue(s) likely to be the (primary) source of glycoprotein in blood | Likely (primary) cell type source of protein in blood | Average plasma concentration (mg·mL−1) (Ref. [2]) | Range of plasma concentration (mg·mL−1) (Ref. [2]) |
|---|---|---|---|---|---|
| IgG | IGHG1 | Bone marrow | Plasma cells | 11.8 (IgG1: 5.03, IgG2: 3.42, IgG3: 0.58, IgG4: 0.38) | 7–18 (IgG1: 5.03, IgG2: 3.42, IgG3: 0.58, IgG4: 0.38) |
| IGHG2 | Bone marrow | Plasma cells | |||
| IGHG3 | Bone marrow | Plasma cells | |||
| IGHG4 | Bone marrow | Plasma cells | |||
| Fibrinogen | FGB | Liver | Hepatocytes | 3 | 2.0–4.5 |
| FGA | Liver | Hepatocytes | |||
| FGG | Liver | Hepatocytes | |||
| IgA | IGHA1 | Lymphoid tissues | Plasma cells | 2.62 (IgA1: 2.358, IgA2: 0.262) | 2.62 |
| IGHA2 | Lymphoid tissues | Plasma cells | |||
| TF | TF | Liver | Hepatocytes | 2.5 | 2–3 |
| IgM | IGHM | Spleen | Plasmoblasts (marginal zone B-cells) | 1.47 | 0.5–2.0 |
| Haptoglobin | HP | Liver | Hepatocytes | 1.32 | 0.8–2.5 |
| α-2-macrogobulin | A2M | Liver | Hepatocytes | 1.2 | 1–2 |
| α-1-antitrypsin | SERPINA1 | Liver | Hepatocytes | 1.1 | 1.1 |
| Hemopexin | HPX | Liver | Hepatocytes | 0.8 | 0.4–1.5 |
| α-1-acid glycoprotein | ORM1 | Liver | Hepatocytes | 0.77 | 0.36–1.46 |
| ORM2 | Liver | Hepatocytes | |||
| Apolipoprotein B-100 | APOB | Liver | Hepatocytes | 0.5 | 0.5 |
| α-2-heat stable-glycoprotein | AHSG | Liver | Hepatocytes | 0.45 | 0.3–0.6 |
| Ceruloplasmin | CP | Liver | Hepatocytes | 0.355 | 0.15–0.96 |
| Vitronectin | VTN | Liver | Hepatocytes | 0.3 | 0.2–0.4 |
| α-1B-glycoprotein | A1BG | Liver | Hepatocytes | 0.22 | 0.22 |
| β-2-glycoprotein 1 | APOH | Liver | Hepatocytes | 0.2 | 0.2 |
| Antithrombin-III | SERPINC1 | Liver | Hepatocytes | 0.15 | 0.15 |
| Histidine-rich glycoprotein | HRG | Liver | Hepatocytes | 0.125 | 0.10–0.15 |
| Apolipoprotein D | APOD | Brain | Glial cells | 0.1 | 0.1 |
| Apolipoprotein F | APOF | Liver | Hepatocytes | 0.0845 | 0.073–0.096 |
| Kininogen-1 | KNG1 | Liver | Hepatocytes | 0.0725 | 0.055–0.090 |
| Zinc-α-2-glycoprotein | AZGP1 | Liver | Hepatocytes | 0.05 | 0.05 |
| Breast | Glandular cells | ||||
| IgD | IGHD | Respiratory mucosa | IgD-secreting B-cells | 0.035 | < 0.003–0.400 |
| IgE | IGHE | Thymus | Plasma cells | 0.0003 | 0.0003 |
Source: compiled from Refs. [2], [30], [31].
TFs are blood plasma glycoproteins that are a key part of iron metabolism and are responsible for ferric-ion delivery. Iron plays a central role in many essential biochemical processes of human physiology; human cells’ requirement for iron as an oxidant has given rise to a complex system that tightly regulates iron levels, tissue distribution, and bioavailability [38]. Human TF has two N-glycosylation sites, at the N432 and N630 residues, where a biantennary disialylated digalactosylated glycan structure without fucose is the most abundant glycan attached [39], [40]. Together with fibrinogen, TF is one of the most abundant non-immunoglobulin human blood glycoproteins (Table 1).
There is little doubt that there are mechanisms that uniquely regulate the glycosylation of specific proteins. For example, a coding mutation that disturbs a canonical N-glycosylation amino acid sequence motif would result in the absence of N-glycan attachment at that site. Amino acid sequence-changing mutations outside the canonical motif that lead to changes in the N-glycosylation spectra of mutated proteins are known [41], [42]. Such mutations may exhibit their effect through changes in tertiary structure that result in modified accessibility of the glycosylation site.
In addition to the considerations described above, it should be noted that the glycosylation mechanism is common to the secreted and membrane proteinsproduced in a specific cell. The peculiarities of this mechanism—that is, the presence or absence (or, more generally, the activity) of specific enzymes—are shared between the cells in a tissue. Thus, although unique protein- and individual cell-specific aspects can be expected, the set of rules governing the N-glycosylation of different glycoproteins in a tissue or a cell type is expected to be the same.
Table 1 shows the average concentration and likely source of major human blood plasma glycoproteins. It is clear that the majority of glycoproteins originate from just two tissues: lymphoid and liver. Therefore, it is logical to hypothesize that the glycosylation of the plasma proteome may be driven mainly by the specifics of the regulation of glycosylation in the lymphoid tissues (mainly plasma cells) and liver (hepatocytes). Under this hypothesis, it becomes clear why studies of the total plasma, IgG, and TF glycomes complement and enhance each other, as we show below.
3. Genome-wide association studies (GWASs) of protein N-glycosylation
Thanks to advances in high-throughput N-glycome profiling methods that have enabled the characterization of glycomes of thousands of samples [43], [44], along with the availability of affordable and precise DNA technologies for measuring common (minor allele frequency > 1%) genetic variation, GWASs have been applied to understand the genetic determinants of the variation of the human glycome. A GWAS is a method to identify the regions of the genome (genetic loci) where variations contribute to variations in studied traits—that is, human quantitative traits and complex diseases. In brief, this method permits the reliable discovery of the effects of genetic variation (e.g., single nucleotide polymorphisms (SNPs)) on the abundance of specific glycans by comparing the genomes and N-glycomes of thousands of individuals. Due to linkage disequilibrium (LD), a GWAS typically leads to the implication of sets of correlated SNPs that show a statistically significant association with the trait of interest. The classical GWAS design assumes a “discovery” stage, in which the associated loci are identified at the genome-wide significant level, and a “replication” stage, in which association at the discovered loci is confirmed in independent samples [45]. Replication improves the reliability of GWAS findings and helps to reduce the chance that a specific observed genotype-phenotype association is a chance finding or an artifact of the design or analysis [46]. Replication is, therefore, an essential step to be taken before the complex and expensive targeted experimental follow-up studies are initiated for a specific locus. A more detailed account of the application of GWAS methodology to glycomics can be found in our recent review [21].
The identification of loci associated with the glycome provides starting points for a better understanding of the glycobiology and its connection with human health and disease. However, next steps are not trivial, as neither functional polymorphism nor the affected gene can be immediately determined through a GWAS. A locus that is identified in a GWAS could encompass dozens of genes; moreover, an unknown functional element in the locus may regulate a gene that is located far beyond the associated region [47]. We touch upon the challenges of linking an associated region to a biological function in the sections that follow. Below, we summarize the gene-mapping results from studies of the N-glycosylation of IgG, TF, and the total plasma proteome (plasma glycome).
Five GWASs of IgG N-glycosylation measured in up to 8000 people have been published so far [48], [49], [50], [51], [52]. Of the 33 genome-wide significant loci discovered in these GWASs, 29 were replicated in independent samples. The first GWAS of the IgG glycome measured with liquid chromatography identified associated variants in or near four glycosyltransferase genes and in five additional loci that did not contain genes with a known role in protein glycosylation [48]. Shen et al. [49] developed and applied multivariate GWAS discovery and replication methods to extend the list by five additional loci, only one of which contained a glycosyltransferase gene. A number of loci were replicated, and one additional locus that did not contain a glycosyltransferase gene was discovered by Wahl et al. [50] in a study that used liquid chromatography coupled with electrospray mass spectrometry (LC-ESI-MS) to measure IgG N-glycosylation.
While the abovementioned studies were limited to a discovery-stage sample size of about 2000 individuals, a recent work by Klarić et al. [51] investigated associations between the IgG glycome and genome in a discovery sample of more than 8000 individuals. The results were replicated in 2400 samples with the IgG glycome measured via ultra-high-performance liquid chromatography (UHPLC) and validated in about 1800 samples with the IgG glycome measured using LC-ESI-MS. Overall, this work brought the number of loci that were significantly associated genome-wide with the IgG glycome to 27, 22 of which were replicated in independent samples.
The summary statistics generated by Klarić et al. were re-analyzed by Shadrina et al. [52] using multivariate summary-based methods for GWAS discovery and replication [53]. Thanks to the multivariate methodology and extended replication sample (N = 3147), this analysis resulted in six new loci, five of which were replicated, and the replication of two previously discovered loci.
Five of 29 replicated loci associated with IgG N-glycosylation contain glycosyltransferases; these are responsible for core (FUT8) and antennary (FUT6) fucosylation, the addition of bisecting GlcNAc (MGAT3), and terminal modifications such as galactosylation (B4GALT1) and sialylation (ST6GAL1). Although the other 24 loci contain genes that fall into multiple classes, a group of genes involved in the biology of antibody-producing cells, such as RUNX3, RUNX1, IKZF3, IKZF1, and TNFRSF13B, should be noted. Other notable associations include one with the human leukocyte antigen (HLA) region, as well as an association with the region that contains genes encoding immunoglobulin heavy chain (IGH)—although this region also contains a secondary candidate (TMEM121, implicated through colocalization of its expression quantitative trait locus (eQTL)). The candidate genes prioritized in the implicated loci are discussed in more detail in the next section.
Compared with studies of IgG N-glycosylation, genetic studies of the N-glycosylation of the total human plasma proteome have somewhat lagged behind in terms of the number of studies, sample sizes, and—consequently—the number of loci identified. Thus far, three GWASs of the human plasma N-glycome, measured in up to 3500 people using liquid-chromatography-based techniques, have identified 16 loci [54], [55], [56]. An overwhelming majority (15) of these loci were replicated in independent samples, either in the original works or in a study by Sharapov et al. [57], which used the largest replication sample size to date, of 4800 people. The study had very high (> 95%) expected power to replicate all but one locus (chromosome 22, near KREMEN1). For the latter locus, the minor allele frequency of the associated insertion/deletion polymorphism rs140053014 was low (about 2%) in the studied populations, which complicated its imputations, hence reducing the number of available samples and power to about 10% and making the replication results inconclusive.
Eleven of the 15 replicated loci overlap with loci discovered in studies of the genetic control of IgG N-glycosylation. These loci contain genes encoding glycosyltransferases: FUT8, FUT6, MGAT3, ST6GAL1, and B4GALT1; and other genes: HLA, IGH, IKZF1, and RUNX3. This may not be particularly surprising, given that immunoglobulins make up a major fraction of the plasma glycoproteome (Table 1). In this context, the four plasma-glycome specific loci, which were not discovered in the GWAS of IgG N-glycosylation despite their larger sample size, may be of particular interest. Three of these contain genes encoding a glycosyltransferase: MGAT5, whose product adds GlcNAc, facilitating further branching of biantennary glycans; ST3GAL4, whose product facilitates terminal sialylation; and B3GAT1, encoding a glucuronyltransferase. In addition, a region containing the gene HNF1A is specifically associated with the plasma but not the IgG N-glycome. The gene was demonstrated to be a master regulator of fucosylation in liver [54]. The GWAS of the plasma N-glycome is reviewed in more detail in Ref. [21].
A recent GWAS of TF N-glycosylation [23], despite a relatively small sample size (discovery sample size of N = 948; replication N = 952), has brought important conceptual advances. Among the eight loci implicated at the genome-wide significance level and replicated, one (containing the TF itself) has not been reported in previous studies of N-glycosylation. Five loci associated with TF N-glycosylation contain genes encoding glycosyltransferases, which are already implicated in the control of total plasma (B3GAT1, MGAT5, and ST3GAL4) or IgG and total plasma (FUT8 and FUT6) N-glycosylation. Additional shared loci include HNF1A, which is shared between TF and total plasma N-glycosylation; and NXPE2/4, which is shared between TF and IgG N-glycosylation. After a meta-analysis of the discovery and replication samples, two more loci achieved genome-wide significance. One of these significant—but not (yet) replicated—loci contained a gene encoding a member of the forkhead family of transcription factors, FOXI1, and another region was located near the gene MSR1.
Landini et al. [23] also specifically studied the colocalization of TF and IgG N-glycosylation association patterns in the FUT8 and the FUT6 regions, which are associated with both TF and IgG N-glycosylation. They concluded that different causative variants are most likely responsible for the association of these loci with TF and IgG N-glycosylation. Six loci reported in Refs. [23], [51] that are associated with changes in human protein glycosylation contain more than one independently associated variant (marked with an asterisk in Fig. 1).
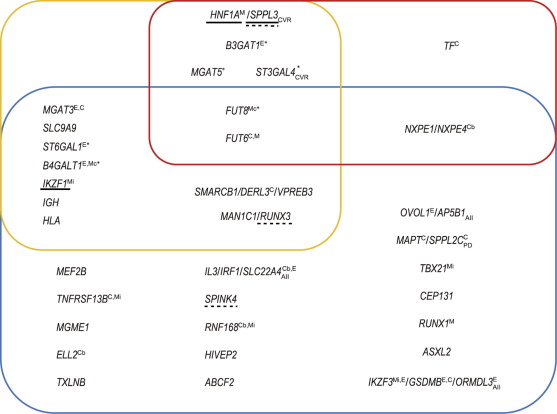
 Fig. 1. Summary of 34 loci robustly associated with N-glycosylation. Loci are named after the proposed candidate gene(s). Upper left (yellow rectangle): loci associated with the plasma glycome; upper right (red rectangle): loci associated with TF N-glycosylation; bottom (blue rectangle): loci associated with IgG N-glycosylation. Gene names in blue are glycosyltransferase genes, in green are transcription regulator genes, and in black are other relevant genes; yellow indicates that the mechanism has not been hypothesized, and the gene indicated is the nearest gene. Underlined genes have experimental support for causation (solid line: classical assays; dashed line: transient system based on HEK-293F cells with stably integrated clustered regularly interspaced short palindromic repeat (CRISPR)/dead CRISPR-associated endonuclease 9 (dCas9)). A lower index denotes colocalization of the locus with: AII: an autoimmune or inflammatory disease; CVR: a cardiovascular disease or its risk factors; PD: Parkinson’s disease. A superscript indicates evidence linking variation in the locus specifically to the function of this gene: C: coding variant in the gene; Cb: coding variant predicted to be benign; E: colocalization with eQTL for this gene; M: the relevant monogenic phenotype is known; Mc: monogenic phenotype of congenital disorder of glycosylation; Mi: monogenic phenotype of immunodeficiency. Loci marked with * contain more than one independently associated genetic variant.
To summarize, nine published GWASs established 34 replicated loci associated with variation in the N-glycosylation of the TF, IgG, or total plasma proteome.
Methodologically, from the results discussed above, we can conclude that—given a sufficiently large replication sample—the glycomic loci discovered in the GWASs have a high replication rate. For example, for the plasma N-glycome, 15 of the 16 loci reported at genome-wide significance have been replicated and one replication was inconclusive [57], while 29 of the 33 IgG N-glycosylation loci have been replicated so far [52]. These results highlight the general robustness of the GWAS findings, as well as the high standards adopted by the community studying the genetic regulation of protein N-glycosylation.
At least in single-protein IgG N-glycosylation studies, we can also conclude that the multivariate methods of genetic analysis demonstrate superior power. Studies of IgG N-glycosylation have empirically demonstrated that the application of multivariate analysis is equivalent to increasing the sample size by 20%–50% [49], [52]. This significant increase in power is likely due to large correlations being observed between different glycans—correlations that are not only large but also biologically meaningful [58], which may provide an ideal case for multivariate analysis [59].
An account of the established loci is summarized in Fig. 1. The domination of loci established in studies of IgG N-glycosylation is obvious in the figure, as is the absence of plasma-glycome-specific loci. While the former observation is likely to be a statistical artefact, the latter probably reflects the true underlying biology.
Indeed, the sample sizes of IgG N-glycosylation studies have reached 8000, while the maximal sizes of plasma glycome and TF N-glycosylation studies are 3500 and 1900, respectively. Empirically, we know that, for a complex trait, the number of loci discovered is roughly proportional to the sample size [60], [61]. Therefore, one would expect that the number of loci established for IgG N-glycosylation (29 loci) is roughly twice that established for the plasma glycome (15 loci) and four times that established for TF N-glycosylation (eight loci)—which is indeed the case. Moreover, we may speculate that the yield of loci per fixed sample size is roughly the same for all three studied glycomes, which may reflect similarities between their genetic effect size distributions and the relative role played by genetic and environmental variation.
The observation that, thus far, any (replicated) locus known for total plasma N-glycosylation can be found to act on IgG and/or TF N-glycosylation is likely to reflect the underlying biology. This observation corroborates the hypothesis that the total plasma glycome could perhaps be conceived as a superposition of the glycomes of proteins secreted to the blood by two primary contributors—namely, lymphoid tissues (mainly plasma cells) and liver (hepatocytes)—and mainly driven by the specifics of the regulation of N-glycosylation in these tissues. However, the glycosylation machinery in other tissues may also have an effect on the glycosylation of plasma proteins [62].
4. Candidate genes in the established loci
Although replication establishes a locus as a reliable starting point for further investigation, neither a GWAS nor replication answers the question of what potential mechanism of action by which variation in the locus leads to variation of the trait. The presence of LD limits the precision of mapping of a functional polymorphism with classical statistical genetic methods. A GWAS makes it possible to establish a list of polymorphisms that contains the causative ones with high probability; however, for a locus, such a list may include tens or even hundreds of candidate polymorphisms. Only extremely large studies can map associations to just a few SNPs per locus [63], if the effect of the locus is large enough, and the LD in the region is not excessive. However, even when it is possible to limit the list to a single causative variant, this still only rarely allows a direct answer to the question of what the biological mechanism of action of this polymorphism is. It might be possible to unequivocally determine the gene target that is affected, but only when the variant is reliably predicted to change the sequence of the protein encoded by the gene. At the same time, the majority of the genetic variation involved in complex traits is regulatory [64]. Although it is often the case that a gene nearest to the variant with the strongest association is indeed the target of that variation [65], it is generally not straightforward to link a regulatory variant to the gene or set of genes being regulated. For example, a functional element perturbed by the associated SNP may affect a target located millions of base pairs apart and may exhibit its action only in a specific tissue [47]. Even more eccentrically, a functional element could target a gene located on a different chromosome through trans-regulatory mechanisms [66], [67].
The identification of causative polymorphisms and genes that explain association is critical in translating the statistical findings of a GWAS into actionable biological knowledge. Targeted functional experimentation is the gold standard to establish the mechanism of action; however, given the multitude of hypotheses that could be suggested for a locus, in silico functional investigation plays a large role in prioritizing possible mechanisms. In silicomethods utilize a large body of accumulated knowledge on the potential consequences of changes in DNA [68], [69] and the functional role of different genomic elements [70], [71], as well as data accumulated in omics studies, including those investigating the genetic control of omics traits [72], [73], [74], [75], [76]. The latter data are especially useful when hypothesizing the potential molecular genetic mechanism underlying a specific association. Summary-statistics-based methods of colocalization analysis [74], [77], [78] can be used to address the question of whether the association of two traits with the same genetic region may be due to pleiotropic effects of the same genetic variant(s) or is instead a consequence of the association of two traits with two distinct—albeit close—polymorphisms. Summary-statistics-based in silico investigation is facilitated by the availability of (online) databases and tools integrating relevant information [79], [80], [81], [82], [83].
In this section, we classify 34 loci that are replicably associated with protein N-glycosylation, according to the function of the proposed candidate gene. For six loci, a candidate gene could not be suggested; in these cases, the region is named after the gene(s) nearest to the most-associated polymorphism (gene names are in yellow in Fig. 1). For five loci, multiple candidate genes with different functions are known, and these are classified in several categories. It should be noted, that in principle, for complex traits, an association to a locus does not have to be due to single causative gene, as multiple candidates in a locus are not necessarily mutually exclusive.
Eight loci contain glycosyltransferase (gene names are in blue in Fig. 1) as the primary candidate gene for the respective loci. It was found that, in eight glycosyltransferases, genetic variation in regions including MGAT3, ST6GAL1, and B4GALT1 is associated with variation in IgG and total plasma N-glycosylation; genetic variation near B3GAT1, MGAT5, and ST3GAL4 relates to TF and total plasma N-glycosylation; and genetic variation near FUT8 and FUT6 is associated with all three studied glycomes. Most of the candidate glycosyltransferases are transcribed in both liver and plasma cells (Fig. 2(a) [84]), although there are several notable exceptions.
 Fig. 2. Expression of candidate genes in hepatocytes (green) and bone marrow plasma cells (pink). Candidate genes are grouped by function: (a) glycosyltransferases and a glycosidase; (b) transcription regulators; (c) other. TPM: transcripts per million. Reproduced using data reported in Ref. [84], with methods and code identical to those used to generate Fig. 5 in Ref. [23].
MGAT3 is preferentially expressed in plasma cells and MGAT5 is expressed in hepatocytes (Fig. 2(a)). This is consistent with the fact that IgG-attached glycans are biantennary, with optionally present bisecting GlcNAc (the reaction facilitated by an enzyme encoded by MGAT3), while the glycans attached to the glycoproteins produced by liver are often multiantennary (MGAT5 plays a role in glycan branching). Higher expression of α-2,3 sialyltransferase-encoding ST3GAL4 in liver, with minimal expression in plasma cells, is consistent with the fact that the locus is implicated in plasma and TF, but not in IgG N-glycosylation GWAS, and the almost exclusive α-2,6 linked sialylation of IgG is a known fact [85]. A stronger expression of galactosyltransferase gene B4GALT1 in liver compared with plasma cells may seem inconsistent with observations that galactose is present in IgG as well as liver glycoprotein N-glycans, and that the locus is implicated only in IgG N-glycosylation. However, it should be noted that the expression of B4GALT1 in plasma cells, although lower than in hepatocytes, is still rather high—that is, it is higher than the expression levels of MGAT3 in plasma cells. Secondly, it should be considered that the tissue specificity of gene regulation may lead to the presence of a glycomic quantitative trait locus (QTL) in one tissue but its absence in another tissue. The latter may also explain why the region near ST6GAL1 seems to be associated only with variation of the IgG N-glycome, despite being expressed to an equally high degree in hepatocytes and plasma cells, and encoding a sialyltransferase facilitating α-2,6 bonds in glycans attached to liver-secreted proteins and immunoglobulins.
In addition to glycosyltransferases, another locus (including the RUNX3candidate gene) contains the gene MAN1C1, which encodes a glycosidase. This gene is expressed with low tissue specificity and encodes a protein involved in the early Golgi stages of the transition from high-mannose to hybrid glycan structures. Given the functional network results of Ref. [51] and the spectrum of associated glycoforms, it is more likely that the causative gene in the locus is RUNX3.
A large group of prioritized candidate genes code for (tissue-specific) transcription regulators (gene names are in green in Fig. 1). For plasma and TF N-glycosylation, HNF1A (located close to another candidate, SPPL3) is an example of such a gene. For IgG N-glycosylation, eight loci contain candidate genes encoding the transcription factor involved in B-cell differentiation and function. These include RUNX1 [86], RUNX3, IKZF1 [87], and IKZF3 [88], which play a central role in B-cell maturation and differentiation; the gene MEF2B, which is mutated in about 15% of follicular lymphoma and which diffuses large B-cell lymphoma and plays a role in germinal center development [89]; the gene ASXL2, with a product whose target genes strongly overlap with those of RUNX1 and is required for normal hematopoiesis [90]; and the transcription elongation factor ELL2, which directs immunoglobulin secretion in plasma cells [91]. The gene TNFRSF13B, located in a recently established locus [52], encodes a lymphocyte-specific member of the tumor necrosis factor receptor superfamily known as the transmembrane activator and calcium modulator and cyclophilinligand interactor (TACI) protein. Signaling through this protein activates several transcription factors, including nuclear factor of activated T cell (NFAT), activator protein (AP)-1, and nuclear factor-κB (NF-κB) [92]. TACI plays a crucial role in humoral immunity, acting in synergy with other signaling networks to promote B-cell differentiation into plasma cells and immunoglobulin production [93], [94].
Many of the suggested candidates that encode transcription factors are differentially expressed in plasma cells and hepatocytes (Fig. 2(b)). The group with stronger expression in plasma cells includes IKZF1, IKZF3, RUNX3, TNFRSF13B, and (perhaps) IRF1. The gene HNF1A has minimal expression in plasma cells but is strongly expressed in hepatocytes. This pattern of expression is consistent with—but is perhaps also partly driven by—the GWAS findings: Indeed, the first group was discovered in a GWAS of IgG N-glycosylation, while the locus containing HNF1A was implicated only in plasma and TF N-glycosylation.
Three loci contain genes with products implicated in B-cell immunity. These include the IgG heavy chain locus (14q32.33) (unsurprisingly, the IGHG1 is expressed very strongly in plasma cells but not in hepatocytes; Fig. 2(c)); the gene VPREB3 (near DERL3 and SMARCB1) coding for a protein, which likely participates in the transport and assembly of the pre-B cell receptor [95]; and the recently suggested [52] gene RNF168, which encodes an E3 ubiquitin ligase protein involved in DNA double-strand break repair and immunoglobulin class switch recombination [96].
Five loci contain genes involved in (not B-cell) immune function: the HLAregion, which contains multiple immune-related genes; a locus that contains a gene coding for T-box transcription factor (TBX21), whose mouse homolog regulates the expression of interferon γ (IFNγ) and controls T helper 1 (Th1) lineage commitment [97]; the gene HIVEP2 [98], [99]; and IRF1, which codes for interferon regulatory factor 1. The region including IRF1 also encompasses the gene IL3 that codes for interleukin 3, a cytokine with an important function in the differentiation and proliferation of hematopoietic and lymphoid cell lineages; and SLC22A4, which encodes OCTN1, the primary transporter of ergothioneine, an amino acid with anti-oxidant and anti-inflammatory properties [100]. In the same locus with the B-lineage specific transcription factor IKZF3 is GSDMB, which encodes a member of a protein family with a role in pyroptosis [101], [102], and the gene ORMDL3, whose product has been shown to modulate T-lymphocyte activation via controlling the influx of calcium ions in the endoplasmic reticulum upon antigen binding [103].
Four loci contain genes involved in the functioning of the endoplasmic reticulum, Golgi apparatus, or endosomes. These include a gene that potentially affects protein glycosylation via regulation of endosomal pH (SLC9A9); the gene DERL3 (near VPREB3 and SMARCB1), which is involved in the degradation of misfolded glycoproteins in the endoplasmic reticulum and is preferentially expressed in plasma cells (Fig. 2(c)); the gene SPPL3 (near HNF1A), which encodes an intramembrane protease that cleaves glycosidases and glycosyltransferases [104]; and a recently [52] established locus containing AP5B1, a gene whose expression is enriched in bone marrow and that encodes a subunit of an adaptor protein complex, AP-5 [105], which is probably involved in facilitating the late endosome-to-Golgi retrieval [106].
In the same functional group, Frkatovic er al. [27] suggested the candidate gene SPPL2C (near MAPT). This gene encodes an intramembrane-cleaving aspartic protease that impairs vesicular transport and possibly causes retention of cargo proteins in the endoplasmic reticulum [107], thereby potentially affecting cellular processes such as protein glycosylation through mislocalization of glycan-modifying enzymes. Another member of the same gene family, SPPL3, which is expressed with low tissue specificity, is known to regulate cellular N-glycosylation [104], [108]. However, the expression of SPPL2C is enriched in testes, with very low expression in other tissues. Another possible candidate for this group is the serine protease inhibitor encoded by the gene SPINK4. However, its expression is enriched in intestine and limited in lymphoid tissues; its possible mechanism of action remains unclear, and experimental validation is not fully conclusive [109]. Given the somewhat contradictory information regarding the possible role of genes SPPL2C and SPINK4, they are indicated in yellow in Fig. 1.
Two genes of notice do not belong to any class outlined above. One is SMARCB1(near to VPREB3 and DERL3), which is also known as BAF47. This gene encodes a core subunit of the adenosine triphosphate (ATP)-dependent chromatin remodeling complex, which plays a key role in the regulation of gene transcription [110]. Finally, for TF N-glycosylation, the gene TF itself is the candidate gene in the locus established by Ref. [23]. In line with known biology, the gene TF is strongly expressed in hepatocytes but not in plasma cells (Fig. 2(c)).
To conclude, even from the somewhat superficial account of candidate genes, it is clear that populational variation of protein N-glycosylation is regulated by genetic variation affecting: ① glycosyltransferases involved in the fucosylation, branching, and terminal modifications of N-glycans; ② tissue-specific regulators involved in the differentiation, maturation, and regulation of cells (hepatocytes and plasma cells) producing relevant glycoproteins; ③ perhaps more speculatively, the cellular machinery involved in the production and transportation of the secreted glycoproteins; and ④ the production and structure of the studied glycoproteins (TF and IgG) themselves.
5. Candidate genes with strong support
Confidence that the genes discussed in the previous section are indeed the ones that determine the association between N-glycosylation and genetic variation in the established loci varies significantly. For example, for loci containing glycosyltransferases (except, perhaps, B3GAT1), the evidence is quite complete and compelling. It is known that these glycosyltransferases are involved in protein N-glycosylation, and that the changes in N-glycosylation associated with the locus are consistent with the known enzymatic activity of the product encoded by the candidate. For a few genes, their effects on N-glycosylation have been verified in cell line and/or model animal experiments. For some genes, mutations leading to a monogenic phenotype that includes (or could be linked to) changes in N-glycosylation are known. Some genes, however, are proposed based on known involvement in the same class of processes, such as immune system functioning; for such candidates, the level of confidence is low. Moreover, even when a strong candidate is present in an established locus, unless the mechanism through which an associated variant links to that gene’s function can be proposed and validated, our understanding of the mechanism of action of the locus is incomplete.
In this section, we selectively summarize evidence for candidate genes with strong support from monogenic phenotypes and/or experimental studies. We discuss potential mechanisms of action and highlight possible inconsistencies. Key facts and references are presented in Table 2 [23], [51], [52], [54], [56], [108], [111].
Table 2. Summary of evidence for candidate gene mapping to the regions implicated by GWASs. Only genes with a role in N-glycosylation strongly supported by a monogenic phenotype and/or experiments are listed. The probability of being loss-of-function (LoF) intolerant (pLI) and observed (o)/expected (e) are the Genome Aggregation Database (gnomAD) [111]constraint metric, with pLI values close to 1 and o/e values close to 0 denoting stronger constraint. Blank cells indicate an absence of evidence at the time of manuscript preparation.
| Candidate gene | pLI | o/e LoF (90% CI) | Link between an associated variant and the gene | OMIM | Monogenic phenotype | Could the phenotype be directly or indirectly related to N-glycosylation? | Direct experimental support |
|---|---|---|---|---|---|---|---|
| Glycosyltransferases gene | |||||||
| MGAT5 | 1.00 | 0.07 (0.03–0.18) | — | — | — | — | — |
| ST3GAL4 | 0.04 | 0.31 (0.17–0.61) | Yes, eQTL colocalization [56] | — | — | — | — |
| FUT6 | — | — | Yes, coding variant (for plasma and TF N-glycosylation) [23], [56] | 613852 | Fucosyltransferase 6 (FUT6) deficiency; autosomal recessive; the Lewis negative phenotype is found on red cells of 95% of these FUT-deficient individuals | Yes, directly | — |
| FUT8 | 0.01 | 0.3 (0.18–0.51) | — | 618005 | Congenital disorder of glycosylation with defective fucosylation 1 (CDGF1), FUT8- congenital disorder of glycosylation (FUT8-CDG); autosomal recessive | Yes, directly | — |
| MGAT3 | 0.15 | 0.28 (0.14–0.63) | Yes, eQTL colocalization found in Ref. [51] | — | — | — | — |
| ST6GAL1 | 0.23 | 0.25 (0.12– 0.57) | Yes, eQTL colocalization found in Ref. [51] | — | — | — | — |
| B4GALT1 | 0.04 | 0.33 (0.17–0.70) | Yes, eQTL colocalization found in Ref. [51] | 607091 | Congenital disorder of glycosylation, type IId (CDG2D), β-1,4-galactosyltransferase 1-CDG (B4GALT1-CDG); autosomal recessive | Yes, directly | — |
| Non-glycosyltransferases gene | |||||||
| HNF1A | 0.96 | 0.14 (0.07–0.33) | — | 600496 | Maturity-onset diabetes of the young, type 3 (MODY-3); autosomal recessive | Yes, directly | [54] |
| IKZF1 | 1.00 | 0 (0–0.16) | — | 616873 | Common variable immunodeficiency, type 13 (CVID13); autosomal dominant | Yes, through hypogammaglobulinemia and decreased number of B cells | [51] |
| IKZF3 | 0.98 | 0.09 (0.04–0.29) | Yes, eQTL colocalization found in Ref. [51] | 619437 | Immunodeficiency 84 (IMD84); autosomal dominant (provisional) | Yes, through decreased B cells | — |
| TNFRSF13B | 0 | 1.73 (1.14–1.96) | Yes, eQTL colocalization found in Ref. [51] | 240500 | Common variable immunodeficiency, type 2 (CVID2) | Yes, through hypogammaglobulinemia with low serum IgG, IgM, and IgA | — |
| TNFRSF13B | 0 | 1.73 (1.14–1.96) | Yes, eQTL colocalization found in Ref. [51] | 609529 | IgA deficiency, type 2 (IGAD2) | Perhaps, through IgA deficiency | — |
| RUNX1 | 0.65 | 0.19 (0.09–0.44) | — | 601399 | Platelet disorder, familial, with associated myeloid malignancy (FPDMM); autosomal dominant | Perhaps, through thrombocytopenia and platelet disorder | — |
| RUNX3 | 0.84 | 0.13 (0.05–0.42) | — | — | — | — | [108] |
| RNF168 | 0.84 | 0.84 (0.60–1.20) | Maybe (coding variant), see Ref. [52] | 611943 | Radiosensitivity, immunodeficiency, dysmorphic features, learning difficulties (RIDDLE) syndrome; autosomal recessive | Yes, through hypogammaglobulinemia | — |
CI: confidence interval; OMIM: Online Mendelian Inheritance in Man.
As mentioned earlier, for all but one (B3GAT1) glycosyltransferase-containing locus, the changes in N-glycosylation associated with the locus are consistent with the known enzymatic activity of the product encoded by the candidate. For half of glycosyltransferases (MGAT3, ST6GAL1, B4GALT1, and B3GAT1), the likely mechanism of genetic variation transformation into function is transcription regulation, as suggested by a colocalization between a glycomic GWAS and respective eQTL [51], [52], [54], [107] (Fig. 1 and Table 2).
For one glycosyltransferase encoded by FUT6, a coding variant may explain the observed association with the plasma and TF N-glycome [23], [56]. Indeed, in people of European descent, the C allele (with a frequency of 4%) of the polymorphism with the strongest association, rs7255720 [56], is in perfect (r2 = 1) LD with rs17855739-T, which codes for inactivating E247K substitution in the FUT6 catalytic domain, leading to the phenotype of (plasma) fucosyltransferase 6 (FUT6) deficiency when homozygous [112]. Within this phenotype, plasma glycoproteins produced in the liver of affected individuals lack α3-fucosylation [113]. Otherwise, the deleterious alleles of FUT6 may reach high frequency in some populations without apparent clinical consequences.
Recently, Puan et al. [114] demonstrated that FUT6 deficiency compromises basophil function through the selective abrogation of their sialyl-Lewisxexpression; FUT6-deficient basophils rolling on E-selectin are severely impaired. The researchers also demonstrated that FUT6 null allele carriers exhibit elevated blood basophil counts and reduced itch sensitivity against insect bites, concluding that FUT6 deficiency dampens the basophil-mediated allergic response in the periphery. This conclusion was also supported by an observation of lower IgE titers and reduced eosinophil counts.
The loci containing the FUT genes FUT6 and FUT8 have been implicated in both IgG and TF N-glycosylation, suggesting the important role of these genes in the N-glycosylation of proteins produced in different tissues [23], [51]. However, a biologically important conclusion from the work of Landini et al. [23] is that the details of the mechanisms of action of a “common” locus may not coincide for two glycoproteins, as reflected by different causative variants associated with the N-glycosylation of each of them. This finding suggests that, although some enzymes are involved in N-glycosylation in several tissues, their genetic regulation in these tissues may differ.
A possible mechanism has been suggested for the locus containing FUT8. It is known that the expression of FUT8 is regulated by the Ikaros family zinc finger 1 (IKZF1) [51] and hepatocyte nuclear factor 1-α (HNF1A) [54] transcription factors in plasma cells and hepatocytes, respectively. Many variants in the FUT8region are independently associated, and it can be speculated that some groups may affect the binding of HNF1A and consequently change the fucosylation of liver-secreted glycoproteins, while others may affect the binding of IKZF1 and consequently change the fucosylation of IgG. Thus, perhaps the most parsimonious biological explanation in this case is that different causative variants may affect the binding of different transcription factors in different tissues and therefore regulate the glycosylation of the tissue-specific proteins—that is, the TF produced in liver and the IgG produced by plasma cells in a tissue-specific manner. Although this explanation aligns with general knowledge about transcription regulation (i.e., Ref. [74]), verification of this hypothesis would require further in silico studies and experimental functional validation.
For the FUT6 locus, the mechanism should be at least partially different than the described above mechanism for the FUT8 locus. In plasma glycome and TF N-glycosylation GWASs [23], [56], [57], the variants with strongest association were in strong LD with inactivating E247K polymorphism that leads to dysfunctional FUT6 (described in more detail above). In IgG N-glycosylation GWASs, however, the SNPs with the strongest association (rs35222081, rs874232, and rs12986368) are distinctly different [23], [51], [52] and are in weak (r2 < 0.1) LD with coding polymorphism. The fact that deactivating FUT6 mutation does not show an association with IgG N-glycosylation may suggest that a different gene in the region is responsible for association in the case of IgG N-glycosylation.
The evidence for the gene B3GAT1, which is associated with variation in plasma glycome and TF N-glycosylation [23], [56], is somewhat contradictory. On the one hand, the evidence supporting this gene is strong: The candidate encodes a glycosyltransferase, and its role has been reinforced by a colocalization analysis that suggests that the same functional variant may explain the association with plasma glycan levels as well as the expression of B3GAT1 in liver (Fig. S1 in Appendix A). However, B3GAT1 is a member of the glucuronyltransferase gene family, encoding glucuronyl transferase, which acts in the biosynthesis of the carbohydrate epitope human natural killer-1 (HNK-1), adding a glucuronic acid(GlcA) to the terminal N-acetyllactosamine (LacNAc) disaccharide to form the HNK-1 epitope precursor [115], [116]. The HNK-1 epitope is expressed on a subset of human lymphocytes, including natural killer cells. This epitope has not been reported to exist on plasma proteins. Although Huffman et al. [55]reported the presence of GlcA on some glycans contained in the DG13 plasma glycan peak associated with the B3GAT1 region, these results have not yet been replicated; it is unclear whether this observation may fully explain the observed association.