1. Introduction
The growing awareness of the global climate crisis (IPCC, 2021) has increased interest in finding ways of mitigating its impact (UNFCCC, 2016). The ongoing energy system transition to achieve net zero or negative greenhouse gas emissions is broadly recognised as a necessary step to avoid irreversible planetary scale aftereffects (Bogdanov et al., 2019, Breyer et al., 2022, Hansen et al., 2019, Jacobson et al., 2019, Luderer et al., 2021, Pursiheimo et al., 2019). The rapid capacity growth of renewable energy (RE) technologies, which are required for the energy transition, such as solar photovoltaic (PV) modules (Bogdanov et al., 2021, IRENA, 2019a, Sens et al., 2022, Victoria et al., 2021), wind turbines (IRENA, 2019b, Sens et al., 2022), and battery electric vehicles (BEV) (Greim et al., 2020) raises questions on whether the available volumes of new primary (fresh raw) materials are sufficient to build the whole new energy system (Valero et al., 2018a). Even though there is no consensus on future capacities of solar PV, wind power, and BEV (Sens et al., 2022), several studies show a strongly increasing trend of installations for all of these technologies. Solar PV and wind power capacities grow several folds from the current (as of 2020) 760 GW and 743 GW (REN21, 2021), respectively, to approximately 14 TW and 8 TW by 2050 according to the net zero emission scenario requirement of studies by International Energy Agency (IEA) (2021a) and IRENA, 2021, IRENA, 2019b, IRENA, 2019a). Other studies analyse various capacity projections and report a substantially sharper capacity increase by 2050 to a median-maximum values range of 20.5–70 TW and 8–18.2 TW for Solar PV and wind power technologies, respectively (Sens et al., 2022). In turn, the fleet of electric vehicles is projected to grow from 10 million cars in 2020 (IEA, 2021b) to more than 300 million cars by 2030 according to different estimates (Greim et al., 2020, IEA, 2021c, Walton et al., 2020) with the potential to grow to more than two billion around 2050 (Greim et al., 2020, Khalili et al., 2019). Such a rapid capacity growth is projected to result in a surge of raw materials demand and may even lead to potential shortages of materials in the decades to come (EC, 2020a, Giurco et al., 2019, Junne et al., 2020, Watari et al., 2019).
The expected increase of material demand has attracted the attention of various studies over the past decade. The studies come in various forms, i.e., those evaluating (i) material demand related to an increase of installations in some specific technology (Cristóbal et al., 2020, EC, 2020a, Elshkaki, 2020, Greim et al., 2020, ICMLR, 2016, Jones et al., 2020, Kim et al., 2015, Lennon et al., 2022, Wilburn, 2011), (ii) material demand for energy transition scenarios (Arent et al., 2014, Calvo and Valero, 2021, Elshkaki and Shen, 2019, Giurco et al., 2019, Grandell et al., 2016, Hund et al., 2020, IEA, 2021d, Junne et al., 2020, Månberger and Stenqvist, 2018, Turner et al., 2013, Valero et al., 2018a, WBG, 2017), and (iii) those dealing with the requirement for the green and digital “twin” transitions (EC, 2020b, EC, 2020c). In most of these studies, material requirements for the energy transition and related energy technologies take the centre stage on a regional scale (Arent et al., 2014, EC, 2020b, Kim et al., 2015, Turner et al., 2013, Wilburn, 2011). The remaining studies then deal with the requirement on a global level (Grandell et al., 2016, Hund et al., 2020, IEA, 2021d, Junne et al., 2020, Månberger and Stenqvist, 2018, Valero et al., 2018b, Valero et al., 2018a, Watari et al., 2019, WBG, 2017;). In general, these studies show that the demand for materials increases over the coming years due to the enormous capacity ramping of technologies for the energy transition.
A study by European Commission (2020a) that analysed the material demand for wind power and solar PV from now (2018) up to 2050 found that the material demand increases considerably as the capacity of these technologies grows for both Europe and the world. The growth in material demand for both technologies could lead to raw material demand stress during the energy transition. The European transition to green energy technologies as stipulated by the European Green Deal could be endangered by supply security of several related materials such as gallium, germanium, indium, selenium, silicon, tellurium and rare earth elements (REE) (EC, 2020a). It is crucial to mention that this study anticipates only about 12.5 TW of PV capacity by 2050, less than expected by the IEA and IRENA net zero scenarios. Goldschmidt et al. (2021)examined material demand for a higher PV capacity growth, specifically in a range of 20–70 TW by 2050, which is in line with various studies (Bogdanov et al., 2021, Bogdanov et al., 2019, Haegel et al., 2023). The authors concluded that in order to be resource efficient and to avoid potential supply shortages, upholding the present high rate of technological innovation will be as necessary as investing in PV manufacturing capacity. Lithium demand and supply was also studied in connection with the anticipated fast demand growth for battery applications, and mandatory establishment of efficient recycling was reported to overcome the projected short-term supply shortage as well as to ameliorate the long-term sustainability risks to the global energy transition up to the end of this century (Greim et al., 2020). In short, the rate of increase in demand for a given material is dependent on various factors, such as, an assumed transition pathway and technology-specific material demand. Nevertheless, in all cases, the discussion on the group of materials that are classified as “critical” receives emphasis as a potential source of risk in the coming decades.
Several materials, which are relevant for the energy transition, are generally classified as critical (EC, 2020b, Hund et al., 2020, IEA, 2021d, Junne et al., 2020, WBG, 2017). In this study the term “material” includes geological minerals or compounds as well as various other organic and inorganic, metal and non-metal elements, minerals, rocks, and materials. The criteria for classifying a material as critical is, however, dependent on the focus of the evaluating body and does not necessarily assume materials, which are relevant for sustainable technologies and the energy transition. In general, a group of such factors as resource availability, possible supply risks and import reliance, economic importance, substitution possibility, environmental implication, and others (EC, 2020d, USGS, 2018) contribute to this classification. The concept of criticality is rather complex and lacks a unified methodology (IRENA, 2023). There is neither a general and globally accepted list of critical materials nor a complete data on the production, reserves, and resources of such materials. For example, both, the United States (FREO, 2020, USGS, 2018), and the European Union (EC, 2020d) define critical materials as the ones that are important for the local economy. The European Commission (2020d) acknowledges the importance of critical raw materials for the future, noting that the need for such materials will replace the current dependence on oil. This somehow differs as compared to the criteria that considered the global framework as in the studies of the IEA (2021d) and World Bank Group (WBG) (2017).
The uncertainties related to the local criticality rankings and their connection to the global economic sustainability emphasise the fundamental questions on the use of the term criticality and its practical implication to the achievement of sustainable energy system transformation. Understanding of the long-term and short-term sustainability risks associated with critical materials on the global level as well as the required potential global warming mitigation techniques to be followed at both the point of extraction and at the point of use is essential to create a global framework that can limit the risk to the global economy and associated local concerns. Thus, understanding the way materials flow through the global economy will be fundamental in giving sustainability risks a proper perspective.
There are two important aspects in developing understanding of material sustainability risks globally. The first aspect is the quantifying of the global material resources in general and the expected demand for production with the expected change in our economic activities. The two well-known databases, which comprise such data, are the United States Geological Survey (USGS) (2021) and the British Geological Survey (BGS) (2021). The second aspect is understanding the use of each specific material and exploring the possibilities to achieve its circularity. Materials extracted from the ground are important to maintain and improve our standard of living as they are required for the production of goods. Their flow in the economy occurs in various forms as they become part of different products, which, as a consequence, affects the manner of their disposal and/or their ability to be recovered. Thus, understanding how much material circularity may address material criticality might be very helpful.
This review paper explores the research gaps on a lack of a unified criticality methodology and investigates the connection of local criticality rankings to the global long-term economic sustainability and to the ongoing energy system transition. Thus, the paper presents a list of critical materials for the energy transition based on their linkage to the renewable energy technologies. Possible long-term issues for critical materials are addressed by analysing various literature sources and databases on material reserves, resources, and production. Additionally, logistic bell curve production projections are applied in frames of the supply side approach to understand to what extend the concept of criticality highlights risks for global sustainability and its implication on materials extraction and use. Even though the supply of critical materials will be largely driven by future energy or broad demand scenarios, the point of the logistic bell curves is not to project the future supply, but to analyse resource management possibilities by estimating theoretical production trends and peaks based on the historical production data and resources. Moreover, the paper examines whether the local concept of criticality is consistent with the global resources and the traded goods depending on it, and the role that material circularity will play if the criticality concept is properly implemented on a planetary level.
Following this introduction, Section 2 outlines various critical materials lists, presents classification and analysis of their methodological basis, and reviews their suitability for the global long-term materials availability investigation defining critical materials for the energy transition. A review of the global databases of materials, data on materials production and global material flow, reserves, resources, and recycling, and assumptions to fill statistical data gaps are presented in Section 3. Besides that, this section also includes our projections of the production peaks of materials, the time of depletion of their deposits, the role of recycling, and possible primary materials supply bottlenecks using the bell curve method. A literature review of materials that are critical for the energy transition, is presented in Section 4. Conclusions are presented in Section 5.
2. Overview of critical materials classifications
The analysis of data found in literature shows that the term criticality is applied to materials in a broad context (Andersson, 2020, Bartekova and Kemp, 2016, EC, 2017a, Greim et al., 2020) that has been changing as it undergoes regular re-evaluation over time as the concern for raw material supply increases due to the growing demand and tightening of supply (Graedel et al., 2015, Hund et al., 2020, IEA, 2021d, JRC, 2011, Valero et al., 2018a, Watari et al., 2020, WBG, 2017). However, the present use of the term could be categorised into two broader groups, each with possible subcategories based on the methodologies used for material classification. The first group follows experts’ opinions, while the second one bases its classification dominantly on global supply and demand analyses. Despite the difference in methods of material classification showing a widely varying meaning of the term “critical mineral”, it is clear that all emphasise that the term refers to materials that performs essential functions for which there is an identified risk of supply restriction of some kind (be it due to availability, political, or environmental factors). For example, an executive order from the US president (FREO, 2017) states that “critical mineral” is a mineral (i) identified as a non-fuel mineral or mineral material essential to the economic and national security of the United States, (ii) having a supply chain vulnerable to disruption, and (iii) that serves an essential function in the manufacturing of a product, the absence of which would have considerable consequences for the economy or the national security. Similarly, the 2020 communication of the European Commission (2020e) identified critical minerals as raw materials that are most important economically, due to their essential functioning and integrity to industry, and have a high risk of supply shortage. Even though both definitions are essentially the same, differences in local contexts leads to different list of materials as can be seen in Table 1.
Table 1. Materials’ criticality and relevance to the energy transition. Green markings stand for the materials, which were identified as relevant to the energy transition and chosen for a further analysis. (Ganguli and Cook, 2018, Kiemel et al., 2021, Shah et al., 2021.)
 |
 |
 |
 |
2.1. Criticality classification using experts’ opinions
The criticality classification made by the European Union (2020d), USGS (Schulz et al., 2017, USGS, 2018), the governments of China (Andersson, 2020), Japan (Austrade, 2019, Hatayama and Tahara, 2015), Canada (2021), Australia (Austrade et al., 2020), and various researchers (Bartekova and Kemp, 2016, Eheliyagoda et al., 2020, Harper et al., 2015, Machacek, 2017, Nassar et al., 2015, Nassar et al., 2012, Panousi et al., 2015) fall under this category.
The European Commission’s list of critical materials (2020d) is based on two indicators that evaluate their economic importance and the associated supply risk factors in the context of the EU. Materials that meet or exceed the threshold values for these parameters are defined as critical for the EU. The “economic importance” parameter is evaluated by considering other factors such as a materials’ end use share in the manufacturing industry sector, the value added for the economy, and the possibility and the cost for substitution in end use applications. In turn, the supply risk parameter comprises factors representing the global supply mix of countries together with their associated political and trade risk, EU sourcing, its import reliance, the end-of-life recycling possibility, and the possibility of supply substitutions. However, while the European Commission follows the detailed guidelines to estimate the criticality-related parameters and subfactors, there is no unified and quantitative methodology presented to estimate the threshold values (EC, 2017b). So-called “candidate materials” are compared to each other based on their impact on the EU economy. Although the materials’ importance to renewable energy technologiesis marked as a leading criterion for defining criticality of materials, the EU’s criticality is based on a broader consideration of other sectors of the European economy. Similarly, the US definition of critical materials (Fortier et al., 2018) excludes uranium from the list of critical materials since it is a fuel material. However, its local importance for national defence was one of the reasons for its inclusion in the list of critical materials (Table 1).
Critical materials for the US are defined by the USGS using indicators related to the materials supply disruption risk and importance to the national economy and defence (Fortier et al., 2018, USGS, 2018). On the first stage of the analysis, three parameters, namely, supply risk, production growth, and market dynamics factors related to selected materials are evaluated, normalised, and combined into a criticality score. At this initial stage of screening, the authors of the study intend to identify materials with risk of security of supply from a global perspective. In the second stage, which includes a closer evaluation of each specific material, a more specific look at the US condition is considered by including indicators, such as US import reliance and importance to specific sectors of the local economy and defence. Similar to the EU, the US methodology suggests a quantitative assessment to define critical materials by meeting threshold values for chosen parameters (Nassar and Fortier, 2021). Even though the quantitative methodology itself differs from the one in the EU, the factors it includes generally follow the similar ideas and principles with exception of the negligible attention given to issues of substitution in the US methodology.
The government of Japan defined its list of so-called “strategic minerals” following similar to the EU and US principles. The similar parameters are also accounted for the Canadian list of critical materials (Government of Canada, 2021) even though provincial governments appear to emphasise the importance of possible material substitutions and clean technology development (Gouvernement du Québec, 2020). Australia forms the local list of critical materials by applying the existing criticality lists and methodologies from the EU, the US, and Japan on the local material deposits (Austrade et al., 2020). The critical material list in Australia has a different meaning compared to the material consumption-based connotation of countries discussed above. In this case, the list has a supplier-based connotation and provides technical details of Australia’s critical material development projects. This list is focused on achieving Australia’s national interest of making considerable contributions to meeting the increasing material demand and enabling the diversification of the global upstream supply chain.
The Chinese classification appears to merge materials categorised by the local supply risk with those that are dominantly produced in China. Like the other countries, its criteria emphasise the importance to the local economic development, security, defence and supply risk (Andersson, 2020). The Chinese “strategic materials list” shows that the criteria have a weak connection to renewable energy technologies and contradicts the consensus that critical materials refer to the forward-looking non-fuel materials because of the inclusion of fossil fuel materials. Contrary to the concept of critical materials of the EU, the US, Japan and Canada, the Chinese “strategic mineral list” also includes six materials that China has in abundance, namely tungsten, tin, antimony, REE, crystalline graphite, and fluorite. Unlike others, the Chinese classification was not driven by the interest to mitigate supply risk but by the interest to gain competitive advantage over other countries. Consequently, China has introduced a resource policy that uses export taxation and applies production and export quotas to regulate and restrict the use of some materials. Most of the materials that are designated as critical by the EU, the US, and Japan are also materials that are dominantly produced in China. According to the criticality evaluation methodologies of those countries, highly concentrated material production is linked to higher supply disruption risk. Summing up, the localised criticality designation concepts are intended to promote the interests of the specified nation or region and, as such, is the reason for the lack of the globally identified critical material list.
In general, these classifications are rather influenced by policy makers and relevant experts of specific countries than by an objective classification aimed to achieve both a short-term and long-term sustainable global economy. These classification methodologies can be characterised as: (i) relying on historical and present data, (ii) using no indicators that may link criticality to material availability using resource and reserve values, and (iii) reflecting political constructs, created based on experts’ opinions of the country’s future materials demand and associated risk, and influenced by public financing in the short-term. Consequently, these classification techniques have more of a short-term, in the order of a decade, local risk aversion role rather than a goal to achieve a long-term solution. The localised criticality concepts may jeopardise the ability to mitigate the challenge of material supply if global cooperation cannot be achieved.
However, the following three reasons make a global concerted effort to understand and mitigate the challenge crucial: (i) unlike fossil fuels, which lose their initial properties by the end of their lifetime, most metallic materials can be used to form new useful compounds to manufacture various products. Some materials can be recovered through recycling techniques without losing their initial physicochemical properties after the end of the life of the associated products. (ii) Materials are traded as part of the product that utilises it, which could be utilised anywhere on the planet. As a result, if efficient end-of-life recycling of the product is achieved, these materials could eventually flow back through a reverse loop as part of a new product or even a material commodity. Thus, conceptualizing a new circular business model that can enforce responsible use of these resources throughout the planet is much more advantageous in enabling a prosperous long-term global economy. (iii) The global economy is highly interconnected so that a shockwave at one place can propagate to other places easily (Gałaś et al., 2021). In this regard, the local strategy may help in understanding risks. However, it may not be an effective strategy in solving long-term problems as improper material use and management could eventually derail the long-term sustainability of the global economy (IEA, 2023, IRENA, 2023). Thus, the discussion of criticality should be centred on the understanding of material flows and of the advantages it creates to the long-term sustainability of the global economy insofar as it is guided by just and common long-term purpose. The present problem of this group of classification is that it partly follows short-term local conditions.
2.2. Criticality classification based on resource and demand analysis
This classification is predominantly based on supply and demand analysis and comes mostly from academic literature and some international organisations such as WBG (Hund et al., 2020, WBG, 2017) and IEA (2021d). Such a group of academic literature and international organisations reports does not necessarily create a classification but determines criticality of some materials based on an analysis that sometimes may contain experts’ opinions. The criticality analysis comes in the form of detailed long-term economy-wide analyses of specific materials or as an analysis that undertakes the demand for key economy sectors or technologies.
The WBG (Hund et al., 2020, WBG, 2017) approaches the question of the role of materials in the future carbon-constrained economy from a broad angle. The first study by the WBG (2017) analyses material demand for the energy system under various climate change targets by taking wind power, solar PV, and energy storage technologies as a proxy. A later study by the WBG (Hund et al., 2020) deepens the subject by expanding the number of energy technologies and improving the methodology. Among the most relevant advances in methodology is their consideration of the impact of the reuse of recycled materials and the creation of a demand risk matrix to identify the level of impact of a given material on the energy system based on their assumed scenarios. The study excludes several materials due to various limitations and thus the corresponding list provided in Table 1 is not yet comprehensive.
However, two important lessons can be learned from such studies. First, critical materials in this context can be understood as materials that have the potential to become a bottleneck to the global economy (taking the implication to the energy industry as a proxy) due to possible supply risk to arise in the event of material production shortage. However, it is worth noting that the link of criticality to material availability is still weak due to the limitation of this analysis, which uses only 2018 production values as a reference for those materials even though production is not a static value and changes with time depending on various factors. Second, if more comprehensive approaches are pursued globally, then the discourse of criticality can be used to create an environment where long-term and short-term sustainability of the global economy receives attention. Simultaneously, the risk and opportunities for all stakeholders, namely miners, manufacturers, consumers and recyclers can be properly identified. This would have a much-needed impact, compared to the presently localised views that are driven either by the perspective of consuming or producing countries.
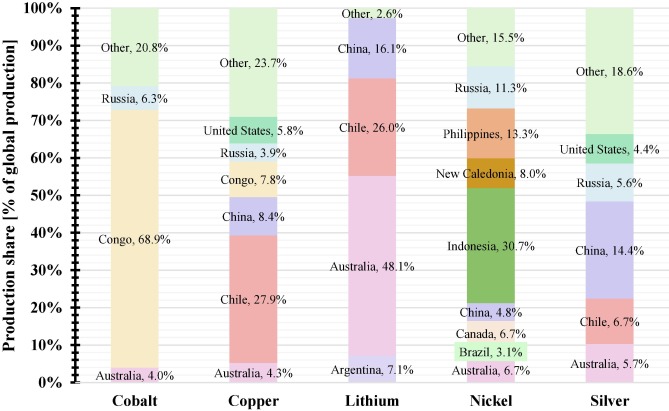
Similarly, the IEA (2021d), which also uses the term “mineral security” along with “critical mineral”, studied the availability and reliability of material supply to achieve the energy transition. Thus, the materials included in its study are identified based on their relevance to emerging and fast scaling energy technologies. As compared to the WBG, the IEA includes a greater number of materials, which are assumed to have substantial security implications to energy sectors. Although aluminium was classified as a high impact critical material by the WBG due to its application in several energy technologies, the IEA remains vague as it excludes it from their study by claiming that it is regularly projected as a part of other IEA studies (IEA, 2021d, IEA, 2021a). In addition to this, the IEA also analyses material demand for other sectors to better understand the overall contribution of energy technologies to the demand and related supply-side challenges by selecting five focus materials: copper, lithium, nickel, cobalt, and neodymium (as a representative for REE). It is crucial to mention that the selected energy scenarios of the IEA and the WBG may not reflect the level of severity related to transition options that more rapidly transition to renewables (see Section 4).
Another group of global studies are those conducting overall demand and supply analysis of selected materials, as for lithium in Greim et al. (2020) and silver in Li and Adachi (2019). The results of these studies show that these materials could become bottlenecks to the energy transition without further measures such as the establishment of efficient recycling for the case of lithium and substituting silver in PV manufacturing (Victoria et al., 2021, Zhang et al., 2021). These materials also carry long-term sustainability risks to the energy transition and the economy in general. Summing up, the global criticality concept has the potential to directly link to the material availability and related short-term bottleneck as well as its long-term sustainability risk. The global criticality concept also has the special capability to identify the problem in global material markets and provide remedy as compared to the localised concept.
Table 1 provides the list of critical materials according to seven different sources, five countries, and two international organisations. The table also includes the data on the end-of-life recycling input rate (EOL-RIR) in Europe, and the materials area of applications together with their specific use in sustainable energy technologies like solar PV, concentrating solar thermal power (CSP), wind power, electric vehicles (BEV and plug-in hybrid electric vehicle (PHEV)), batteries, bioenergy, hydropower, and electrolysers (EC, 2020a, IEA, 2021d, Valero et al., 2018a). Green markings in the table stand for materials, which were identified as relevant to the energy transition based on their application in renewable technologies and thus chosen for a further analysis. Even though coal, methane, natural and shale gas, and uranium are listed as critical materials in some of the above-mentioned assessment regions, fossil fuels are not the focus of this study because they contradict with the transition towards a 100% renewable energy system (Bogdanov et al., 2021).
In summary, the foregoing discussion and Table 1 show that the critical material list changes depending on location due to the difference in the needs of local economies, available resources, and related politics. Only a handful of materials, namely antimony, cobalt, lithium, natural graphite, REE, and tungsten, are included in all five governments critical materials lists. The lists presented by the IEA and the WBG are based on the need of the energy system, shortening the list further. In general, the foregoing discussion shows that the term criticality is very fickle and constantly changing with time and location. Consequently, the local criticality criteria are formulated (by considering different sectors of economy, environmental targets, local supply risks, and political reasons) leading to the difference in the critical material lists. The localised interpretation of criteria typically has nothing to do with the global material criticality. In the next section, the global databases of materials that are critical to the energy transition are studied to gain more in-depth knowledge about the global versus local criticality context.
3. Materials production, reserves, resources, and recycling
Materials can be supplied from primary and secondary material flows. Primary production refers to materials directly mined from geological bodies whether or not it requires further processing methods (EC, 2019). Secondary production indicates materials extraction from end-of-life products, waste, and scrap by recycling (EC, 2020d, EC, 2019). Since most geological deposits are heterogenous, such formations consist of a few materials that can be extracted alongside a primary product of mining, and, hence, other materials become its by- or co-products. While co-products carry the same value as a primary material, which can cover its mining expenses, by-product materials are not the planned products of an initial mining process and are not included in the cost of mining formation (Keller and Anderson, 2018).
Materials that are currently available on our planet for further extraction are usually reported as material resources or reserves depending on the level of geological knowledge and confidence (Gandhi and Sarkar, 2016). Natural deposits that have an accumulation of materials in quantities that are technologically extractable and economically viable are called ore deposits or reserves. The remaining deposits constitute those that may become economically viable as extraction technologies improve or as economic conditions change as the demand for that material increases (Haldar, 2013). Reserves and resources of any material are not a constant value and can change over time. When some part of resources becomes profitable to mine, it becomes a reserve, and when new deposits are found, both quantities (reserves and recourses) may change (Wellmer, 2008). Typically, information on reserves and resources is available from specific national sources on mining, for example from statistical data of national geological surveys, ministries, and industrial associations. International sources, such as USGS (2021) and BGS (2021) provide both global and local data compiled based on official national statistics while also validating other sources.
Due to high uncertainty and disparity of the data on reserves and resources, three scenarios, namely Low, Medium and High production scenarios, were defined for all researched materials having the appropriate data (Table 2). In this study, reserves and resources are assumed to be depleted when reaching its total extraction share of 99% and 95%, respectively, due to the specific differences of its geological confidence.
Table 2. Scenarios of the logistic bell curve calculation.
| Scenario | Low scenario | Medium scenario | High scenario |
|---|---|---|---|
| Quantity base (2020) | Reserves | Average of reserves and resources | Resources |
| Depletion rate | 0.99 | 0.95 | 0.95 |
Table 3 presents the production type, 2020 production values, corresponding reserves and resources estimate, years of production left until reserves and resource depletion, and production peak years for materials that are assumed to become relevant to the energy transition.
Table 3. Critical materials’ geological data, and reserves, resources and its depletion estimates.
| Material | Dominant production(BGS, 2011, BGS, 2009; Moss et al., 2013; Peiró et al., 2013, USGS, 2021) | Production (2020) [kt] | Reserves [kt] | Resources [kt] | Years until depletion based on | Bell curve peak | Remarks, specific to each material/data. n/a – stands for not available data | |||||
|---|---|---|---|---|---|---|---|---|---|---|---|---|
| 2020 production | Bell curve | |||||||||||
| Type | Primary commodity | reserves | resources | Low scenario | High scenario | Low scenario | High scenario | |||||
| Aluminium | Primary | 65,100 | 12,000,000* | 30,000,000* | 184 | 461 | 76 | 86 | 2061 | 2079 | * assumed 40% Al content in bauxite (The Aluminum Association, 2021) | |
| Antimony | Primary | 111 | 2,000 | n/a | 18 | n/a | 18 | n/a | 2026 | n/a | ||
| Cadmium | By-product | Zn | 24 | 690* | 5,700* | 29 | 238 | 34 | 107 | 2034 | 2089 | * assumed 0.03% Cd content in Zn ores (Scoullos et al., 2001, IEA, 2021d) |
| Chromium | Primary | 37,000 | 570,000 | 12,000,000 | 15 | 324 | 17 | 62 | 2027 | 2061 | ||
| Cobalt | By-product | Cu, Ni | 142 | 7,600 | 25,000 | 54 | 176 | 40 | 58 | 2039 | 2057 | |
| Copper | Primary | 20,600 | 880,000 | 5,600,000 | 43 | 272 | 39 | 91 | 2038 | 2079 | ||
| Gallium | By-product | Al | 0.33 | 1,513* | 13,845** | 4,625 | 42,339 | 90 | 103 | 2079 | 2102 | * estimated assuming 50 ppm Ga content in bauxite and 40% extraction rate (ICMLR, 2016); ** calculated using Ga content in bearing ores (Lu et al., 2017) |
| Germanium | By-product | Zn | 0.14 | n/a | 36* | n/a | 257 | n/a | 98 | n/a | 2085 | * Gunn (2014) |
| Indium | By-product | Zn | 0.96 | 21* | 356* | 22 | 371 | 22 | 62 | 2029 | 2063 | * estimated assuming 50 ppm and 10 ppm In content in Zn and Cu ores, respectively (Gunn, 2014); ** Werner et al. (2017) |
| Lithium | Primary | 83 | 22,000 | 89,000 | 267 | 1,079 | 45 | 49 | 2046 | 2057 | ||
| Manganese | Primary | 18,900 | 1,500,000 | 17,273,000* | 79 | 914 | 60 | 137 | 2048 | 2115 | * Mn global deposits data (Schulz et al., 2017) | |
| Molybdenum | Primary/by-product | Cu | 298 | 16,000 | 25,400 | 54 | 85 | 39 | 42 | 2040 | 2046 | |
| Nickel | Primary | 2,510 | 95,000 | 300,000 | 38 | 120 | 37 | 57 | 2036 | 2056 | ||
| PGE* | Primary/by-product | Magmatic Ni-Cu-PGE sulphide deposits | * average concentrations of each element in ores were estimated on the basis of approximate individual element grades and ore types (Mudd, 2012, Mudd et al., 2018) | |||||||||
| Pt | 0.17 | 31 | 42 | 183 | 248 | 227 | 167 | 2057 | 2068 | |||
| Pd | 0.21 | 24 | 41 | 116 | 197 | 92 | 84 | 2051 | 2065 | |||
| Rh | 0.018 | 3.98 | 5.01 | 226 | 284 | 95 | 86 | 2061 | 2068 | |||
| Ru | 0.024 | 6.98 | 8.28 | 287 | 340 | 99 | 95 | 2072 | 2082 | |||
| Ir | 0.006 | 1.65 | 2.02 | 268 | 329 | 87 | 77 | 2069 | 2073 | |||
| Os | 0.005 | 1.52 | 1.77 | 290 | 338 | 98 | 84 | 2072 | 2075 | |||
| REE* | By-/co-product/primary | Cu, Au, U, P, Fe, Ti, Zi, Zn | * | ** | *** | * estimated based on the data in Supplementary Table S1; ** estimated based on individual element composition in advanced deposits (Zhou et al., 2017); *** Weng et al. (2015) | ||||||
| La | 54 | 25,325 | 139,805 | 472 | 2,604 | 98 | 119 | 2076 | 2107 | |||
| Ce | 90 | 46,227 | 243,399 | 516 | 2,715 | 98 | 119 | 2077 | 2108 | |||
| Pr | 10 | 4,718 | 19,847 | 452 | 1,901 | 97 | 115 | 2075 | 2104 | |||
| Nd | 34 | 16,070 | 62,433 | 472 | 1,832 | 94 | 109 | 2074 | 2099 | |||
| Sm | 2.72 | 1,552 | 7,707 | 571 | 2,837 | 94 | 114 | 2075 | 2104 | |||
| Eu | 0.47 | 249 | 1,757 | 533 | 3,768 | 103 | 134 | 2080 | 2119 | |||
| Gd | 2.17 | 1,145 | 5,143 | 528 | 2,373 | 100 | 122 | 2078 | 2109 | |||
| Tb | 0.31 | 102 | 827 | 325 | 2,636 | 89 | 104 | 2063 | 2096 | |||
| Dy | 1.12 | 544 | 4,009 | 485 | 3,575 | 124 | 133 | 2076 | 2110 | |||
| Ho | 0.32 | 105 | 695 | 325 | 2,155 | 102 | 115 | 2066 | 2099 | |||
| Er | 0.63 | 262 | 2,554 | 416 | 4,053 | 130 | 150 | 2076 | 2117 | |||
| Tm | 0.15 | 105 | 310 | 681 | 2,009 | 102 | 108 | 2074 | 2095 | |||
| Yb | 0.46 | 263 | 2,486 | 570 | 5,383 | 122 | 136 | 2077 | 2115 | |||
| Lu | 0.15 | 106 | 389 | 687 | 2,531 | 148 | 141 | 2085 | 2109 | |||
| Y | 6.42 | 3,118 | 32,329 | 485 | 5,033 | 108 | 124 | 2071 | 2109 | |||
| Selenium | By-product | Cu | 3.12 | 100 | n/a | 32 | n/a | 39 | n/a | 2035 | n/a | |
| Silver | By-/co-product/primary | Pb-Zn deposits, Cu, Au | 24 | 530 | 1200* | 23 | 51 | 25 | 38 | 2030 | 2040 | * estimated as a difference between the ultimately recoverable reserves of Ag at present, and the amount that have been extracted by the humanity (Sverdrup et al., 2014) |
| Tellurium | By-product | Cu, Pb | 0.56 | 31 | n/a | 55 | n/a | 26 | n/a | 2034 | n/a | |
| Titanium | Primary | 5,154* | 449,506* | 599,341** | 87 | 116 | 73 | 68 | 2056 | 2061 | * estimated based on molar mass ratio of Ti and TiO2; ** estimated assuming 50% TiO2 content in the bearing ores (Mindat.org, 2021) | |
| Vanadium | By-/co-product/primary | Fe, U | 105 | 24,000 | 63,000 | 229 | 600 | 120 | 110 | 2073 | 2096 | |
| Zinc | Primary | 12,000 | 250,000 | 1,900,000 | 21 | 158 | 24 | 78 | 2029 | 2068 | ||
| Zirconium | By-/co-product/primary | Ti, Sn | 595* | 51,824* | n/a | 87 | n/a | 60 | n/a | 2050 | n/a | * estimated assuming 67% Zr content in zircon (Zircon Industry Association, 2021) and using molar mass ratio of Zr and ZrO2 |
General remark: the decrease in the “year until depletion” for some elements is due to the application of a 5% limit to the resource depletion value that has not much difference from reserve values, to which only 1% was applied.
Analysing the data of materials related to the energy transition provides a better understanding of the connection between the criticality concept and the long-term sustainability. Historical production data and reserve and resources estimates corresponding to the identified materials were derived from the USGS (2021) and BGS (2021) databases. Even though USGS and BGS databases were used as the main data sources in this study, other literature data was also used to fill in the data gaps for some materials and for some parameters, which were used in the calculation, as stated in the remarks of Table 3. The data on the share of each individual rare earth element in the total REE oxides production is presented in Supplementary Table S1.
3.1. Global flows of materials
The BGS database (BGS, 2021) provides annual data on the world materials production by country starting from the beginning of the 20th century as well as statistical data on materials’ import and export. Moreover, the database provides geological information, extraction and processing methods, end-use data, and prices for a limited number of material commodities. Similar data on the materials production is published in the USGS database (USGS, 2021) on an annual basis. In addition, the USGS database includes annual global data on materials reserves and/or resources by country, a global interactive map of REE deposits, as well as annualised information on recycling and substitution possibilities, global material-related events, and the US specific material end-use, trades, consumption, and prices.
Both databases provide similar values of materials annual production. However, in case of some by-product elements due to their dependence on primary commodities, some missing data exists. Since by-products are typically associated with the primary products of their mining, it is difficult to estimate the volumes of their production, and, moreover, their reserves and resources. The same applies to elements, which are often found in groups, such as platinum group elements or rare earth elements. For these groups of elements, the data on both production and reserves and/or resources is often published for the whole range of elements combined, making it complicated to estimate specific values for individual elements. In such cases, to fill the statistical data gaps, several assumptions were made in this study (Table 3 and Supplementary Table S1).