1. Introduction
Phosphorus (P) is an essential element to all living organisms and has no substitute. This means, P is crucial for growing crops and hence in food production. Historically, crop production relied on natural levels of soil P and the addition of locally available organic matter like manure and urban waste. To sustain the increased food demand due to the rapid population growth in the mid-20th century, mineral fertilizers from phosphate rock took over as the leading agricultural P input in industrialized countries (Cordell et al., 2009). Still today phosphorus to produce fertilizers and phosphorus-based products is obtained almost exclusively from mined rock phosphate (Geissler et al., 2018; Huygens et al., 2019). However, there exist various unfavorable factors of P-rock mining, such as P scarcity in the next 50–400 years depending on demand dynamics and the risks in P supply due to high prices or geopolitical disruptions (Cordell et al., 2009). In fact, since 2014, P is considered a critical raw material by the European Commission, which indicates that P is economically and strategically important for the European economy but has a high-risk associated with its supply (European Commission, 2014).
Generally, commercially available P fertilizers, e. g. monoammonium phosphate (MAP), diammonium phosphate (DAP) or triple superphosphate (TSP), are water-soluble salts of phosphates that are readily dissolved in soil solution and can be usable by plants. These soluble phosphates are also highly mobile in soil and major part of them often enters surface water bodies through runoff and natural infiltration, resulting in the over-enrichment of aquatic ecosystems(Maghsoodi et al., 2020). This surplus P discharge into waterbodies (approximately 25% of the 250 million metric tons of P mined since 1950 has ended up in water bodies, or is buried in landfills (Rosemarin, 2004)) has led to the point of P becoming an important pollutant. Thus, P represents a risk to water and soil and contributes to environmental problems, such as groundwater pollution, increase in frequency and severity of harmful algal blooms and eutrophication, which results in loss of habitat and biodiversity. Steffen et al. (2015) estimated that globally 14 Mt. P per year flowed from fertilizers to erodible soils, which is beyond the proposed planetary boundary 6.2 Mt. P year−1. Fink et al. (2018) studied P inflow in 100 lakes around the world between the periods 1990–1994 and 2005–2010. Their results showed that total P (TP) loadings to large lakes have not remained static over these periods, estimating TP loadings increase of 82%, 38% and 17% in Latin America, North America and Africa, respectively, due to increasing organic and inorganic fertilizer application. Despite a reduction in chemical fertilizer use over the past 20–25 years in other parts of the world, such as Europe and some areas of Asia, agriculture practices are responsible for 60–80% of P flow from diffuse sourcesto the Baltic Sea, where more than 90% of its area is affected by eutrophication (Barquet et al., 2020). Agriculture, in combination with urban wastewaters and soil erosion, is the source of P inputs to the Mediterranean Sea (0.1 Mt. P year−1) (Malagó et al., 2019). These values display the inefficient and also non-circular use of P, which is also in accordance to estimates that less than half of phosphate inputs reach food supply (Cordell et al., 2009; van Dijk et al., 2016).
At present, technologies to recover phosphorus from P-rich waste streams, such as municipal wastewaters (5–25 mg total P L−1) (Henze et al., 2008) are already known and implemented in large-scale facilities. P concentrations present in municipal wastewater are sufficiently high to cause eutrophication (Maucieri et al., 2020), therefore discharges are frequently regulated. In Europe, the Council Directive 91/271/EECA sets the requirements for discharges from urban waste water treatment plants (WWTPs) to receiving waters depending on the size of the plant (2 mg P L−1 for 10,000–100,000 population equivalent (P.E.) or 1 mg P L−1 for >100,000 P.E.). In these facilities, dissolved P is usually removed by converting it into a solid fraction which is further separated. This process is mostly achieved by adding chemical reagents, e. g. aluminum or iron salts, or promoting the growth of P accumulation microorganisms (Chrispim et al., 2019; Egle et al., 2015).
Although P concentration in agricultural runoff is not as high as in municipal wastewater (García et al., 2020), P inputs from diffuse sources, such as surplus on cropland and fodder, constitute major sources of discharged P to aquatic ecosystems including the coastal ocean (≈25%) (Malagó et al., 2019; Mockler et al., 2017). Hence, in order to prevent eutrophication in natural waterbodies, including lakes and rivers, the upper limit of P concentration has been regulated in many countries. In particular, the European Environmental Agency recommends that P concentration should be less than 0.01 mg P L−1 in standing waters and 0.2 mg P L−1 in flowing waters. The U.S. Environmental Protection Agency recommends P concentration to be maintained under 0.05 mg P L−1 in standing waters and 0.1 mg P L−1 in flowing waters. In Korea, P concentration limits are below 0.01 mg P L−1 in standing waters and 0.02 mg P L−1 in flowing waters (Maucieri et al., 2020).
To prevent significant P losses that lead to eutrophication, the agriculture sector is implementing various strategies (Schoumans et al., 2014; Kalcic et al., 2018; Boutin and Mitsch, 2021). Xia et al. (2020) recently reviewed the progress in source control technologies, such as fertilization management or water-saving irrigation. Although these techniques can effectively reduce surface runoff and nutrient concentrations, achieving the safe discharge concentrations is still difficult (Xia et al., 2020). Moreover, these approaches cannot prevent runoff from flowing into the receiving water; thus, technologies are still required for complete treatment of agricultural runoff. To this regard, a recent study concluded that further investigations on the use of phosphorus filter traps in drainage water, riparian buffers and wetlands should be considered in the context of Denmark to reach adequate mitigation of P losses (Hoffmann et al., 2020).
Theoretically, the practices and experiences for P removal adopted in WWTPs could be applied in agriculture runoff. However, despite the technical feasibility of these methods, they tend to require significant amounts of chemicals, high energy supply and maintenance (Roy, 2017), which is not economically feasible for the agriculture sector as it is a low-profit industry. P concentration in agricultural runoff is lower than in municipal wastewater. However, removing P from agriculture surface wastewaters and reusing it as fertilizer could meet 25% and 3% of the annual European and global P demand for fertilizers, respectively (Figure 1). Despite being lower than the 22% of global P demand that could be met by recovering P from the total phosphorus available in human waste (urine and feces) (Mihelcic et al., 2011), the resource limitations surrounding commercial P-rock reserves and the surplus of P in effluents constitute economic and political incentives for a transition towards a circular economy, closing the P loop.
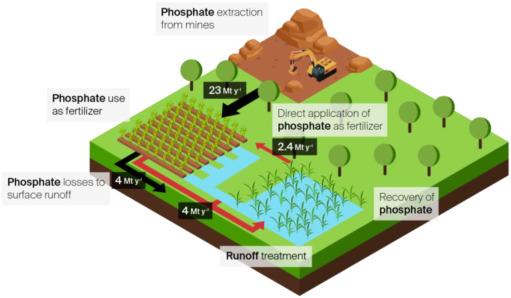
 Fig. 1. Scheme of P cycle under a circular economy approach. The black arrows represent the current P flows: application in soil by using fertilizers produced from mine P-rock extractions and P losses in surface runoff leading to waterbodies contamination. The red arrows represent the P flows in the circular economy approach: P runoffs are treated by methodologies that enable P recover from water and P direct application to the soil, aiming to avoid waterbodies eutrophication and decreasing P-rock mining demand. Values are the global annually fluxes of mined P used as fertilizer (23 Mt. y−1), global P losses in runoff (4 Mt. y−1) and the P that could be recovered and applied directly as fertilizer (2.4 Mt. y−1) considering 60% in efficiencies in P removal technologies and 30% P availability for plant uptake. Data obtained from Ahmad et al. (2018); Bouwman et al. (2013); dos Reis et al. (2020); Fertilizers Europe (2020). (For interpretation of the references to colour in this figure legend, the reader is referred to the web version of this article.)
P management under a circular economy approach (Figure 1) implies the recovery of P from waste streams and further reuse of the recovered products (Barquet et al., 2020; Huang et al., 2014). This includes both capture of P in agricultural and wastewater effluents using adequate technologies, such as natural and constructed wetlands (García et al., 2020). This can lead to better water quality and economic savings. Nevertheless, turning P from wastes into a resource is an extensive task, requiring technical, policy, market and social thinking and action (Geels, 2011). It is expected that the valorization of recovered P from biogenic materials through advanced P recovery pathways might substitute the 17 to 31% of the mined rock phosphate P fertilizers by 2030 in the European Union (Huygens et al., 2019). However, in order to meet future needs of P demand and to alleviate water quality deterioration using a P-recycling approach, several barriers need to be firstly overcome. In one hand, the feasibility of using the recovered materials in agriculture has not received much attention and still needs major research; on the other hand, there are currently barriers at policy level that hampers the use of P recovered products as fertilizer.
In this paper, we build on previous studies of existing technologies to remove P from different effluents, to address the following objectives: (i) provide a general overview of technologies to remove P from agriculture surface runoff waters, which are relatively low in P concentration; (ii) review the role that wetlands can play in the overall P cycle, (iii) present the potential of waste materials to remove P from these streams, and (iv) carry out a detailed analysis on approaches where recovered P can be later applied in agriculture; thus, including the process in a circular management of P.
Literature search was done using the platform Science Direct in the period from September 2020 to May 2021 to compile information about the topic. The applied search terms were “phosphorus recovery”, “phosphorus removal” and “wastewater treatment”. Once the authors had a broad overview of the issue and to identify P recovery technologies adopted in the agriculture sector, as well as methods towards a circular economy approach, a more specific search on the database was performed using the following combined terms: “phosphorus and agriculture runoff”, “phosphorus and agriculture drainage” and “phosphorus recovery and fertilizers”. Later, we explored references cited in those papers and reviews and examine research articles that include (i) natural or synthetic streams with low P concentration (< 2 g L−1), (ii) waste materials as P sorbing agent, (iii) information and/or tests regarding the potential of the tested material to be reused as fertilizer. Finally, to have a deeper knowledge of the real scenario concerning the issue, an extent study from each selected material was done to find articles about field trials assessing the potential P sorbing materials.
2. Existing technologies
Phosphorus typically exists in agriculture waters as particulate phosphorus (PP) and dissolved phosphorus, which is most often in the form of inorganic phosphate (PO4). PO4 is more bioavailable than PP; thus, research is mostly focused on inorganic phosphate removal from waters (Erickson et al., 2017).
We address in this section the current approaches for P removal from agriculture effluents. These are (i) natural wetlands, as buffers between agricultural fields and waterbodies; (ii) assimilation wetlands, that are hydrologically altered natural wetlands that are managed to improve water quality and enhance wetland health; and (iii) engineered systems designed to imitate the natural processes involving wastewater treatment, including constructed wetlands (CWs), ponds or vegetated ditches. A short introduction to wetlaculture (wetlands + agriculture), the trademarked nutrient recycling approach applicable to landscapes around the world is also given (Mitsch, 2017a, Mitsch, 2017b; Mitsch, 2018; Mitsch and Zhang, 2021).
P in wetlands (either natural, assimilation or CWs), ponds and vegetated ditches is typically removed by burial, sorption with metals and clay particles, and to a lesser degree, plant uptake. Burial in sediments integrates numerous processes that remove nutrients from polluted waters, including the settling of organic and inorganic particles from the water column, microbial uptake, and the incorporation of organic matter (e.g., leaf litter or roots) into the sediment. Plant uptake cannot be considered a long-term loss unless P is stored in persistent woody tissue and then ultimately harvested or buried in the wetland. Nutrients assimilated by herbaceous plants, however, can remain unavailable for long periods if they are associated with refractory organic matter that becomes incorporated in the soils (Day et al., 2004).
Wetlands, ponds and vegetated ditches have been demonstrated to be effective nutrient sinks for long periods and at very large scale (20,000 ha or more) and different climates (Collins et al., 2016; Ji et al., 2020; Ma et al., 2016; Vymazal and Březinová, 2018). An estimated 40,000 ha of treatment wetlands, both in the Everglades (Florida, United States) (Mitsch, 2019) and in the former Great Black Swamp (Ohio, United States) (Mitsch, 2017b), and vegetated ditches in south-central Bohemia (Czech Republic), (Vymazal and Březinová, 2018) and in Lake Taihu (China) (Jiang et al., 2007) have been recommended as sustainable solutions for harmful algal blooms and alleviate eutrophication in those regions. However, when the capacities of P assimilation and retention are exceeded, wetlands could become a source of bioavailable P to downstream environments after some years of performance (Audet et al., 2020; Bakhshoodeh et al., 2020). Release of P from the sediments may also occur under anaerobic conditions(Bakhshoodeh et al., 2020).
2.1. Wetland buffers for phosphorus removal
Wetlands are generally defined as shallow water areas or lands that are periodically flooded or saturated long enough to support hydrophytic vegetation and/or other forms of aquatic life (Burton and Tiner, 2009). They work as affective barriers for diffuse nutrient pollution from agriculture, as it was recently reviewed by Walton et al. (2020). Swamp forest bordering Bayou Chevreuil (Louisiana, United States) is an example of it (Kemp and Day, 1984).
Kemp and Day (1984) sampled nutrients in water as it flowed from agricultural fields through the swamp and developed a simple nutrient accounting model of nutrient uptake and release. Organic N and P comprised 77% and 41%, respectively, of total nitrogen (TN) and TP. Nitrate (NO3) was generally less than 0.1 mg L−1. The model indicated strong uptake of NO3 (87%) and ammonium (33%) and release of PO4, organic N and organic P indicating the swamp was removing and transforming inorganic floodwater nutrient concentrations. Lane et al. (2015) characterized surface water quality in the Bayou Boeuf Basin (Louisiana, United States), which receives drainage from sugarcane fields, and reported similar results to the studies discussed above. They reported that NO3levels were generally lower than 0.1 mg L−1, except during high runoff periods when concentration reached 1–3 mg L−1. Hydrological modeling indicated that creating breaks in spoil banks along canals levee would increase N reduction from the current 21.4% to only 29.2% because only a very small fraction of the stormwater carried in channels is exposed to wetlands. Day and Kemp (1985)and Kemp et al. (1985) studied the impact of redox in laboratory microcosms. There was a negative correlation between dissolved oxygen and PO4concentration. They concluded that water quality deterioration in the upper Barataria Basin (Louisiana, United States) was strongly related to bypassing forested wetlands by canals and a great reduction of overland flow. Litter decomposition in the field and in laboratory microcosms showed that more aerated conditions led to higher litter decomposition and higher nutrient concentrations in remaining litter.
2.2. Assimilation wetlands
An assimilation wetland is a natural (non-constructed) wetland into which secondarily-treated, disinfected, non-toxic municipal effluent is discharged (Hunter et al., 2018). Because their primary role is nutrient and sediment reduction, this concept would also work for agricultural runoff. In coastal Louisiana, where there are 13 of these systems, the wetland is typically either a freshwater forested wetland (e.g., bald cypress-water tupelo) or a freshwater emergent wetland (Figure 2). These wetlands have been hydrologically altered (e.g., levees, spoil banks, roads) and freshwater input from sources such as surface runoff or overbank flooding has been reduced from historical norms. Discharge of freshwater effluent containing nutrients and suspended sedimentsinto an assimilation wetland increases vegetation productivity and soil accretion while reducing nutrient and suspended solids concentrations (Day et al., 2019).
 Fig. 2. Locations of assimilation wetlands in coastal Louisiana. Modified from Day et al. (2019).
Wetland assimilation can achieve sustainable low-cost tertiary treatment (i.e., reduction of N and P) of secondarily-treated municipal effluent while benefiting and restoring wetlands (Hunter et al., 2019; Hunter et al., 2009b; Hunter et al., 2009a). A properly designed assimilation wetland can be a more economical and sustainable means of tertiary treatment compared to conventional engineering options (Hunter et al., 2018). The cost of tertiary treatment is a concern as the U.S. Environmental Protection Agency (USEPA) is requiring increasingly stringent limits in discharge permits for wastewater treatment plants. Out of 105 major wastewater treatment facilities in Louisiana, only 12% (13 plants) monitor for N and P concentrations, compared with an average of 57% in the 12 states included in the Mississippi River/Gulf of Mexico Watershed Nutrient Task Force. Of the 26 treatment facilities monitoring nitrogen concentrations and 28 facilities monitoring phosphorus concentrations in Louisiana, 11 discharge into assimilation wetlands (Hypoxia Task Force, 2019).
Monitoring of vegetation, soils, water, and hydrology is required in the Louisiana Pollutant Discharge Elimination System (LPDES) permit for the life of the wetland assimilation project and annual monitoring reports are submitted to the Louisiana Department of Environmental Quality (LDEQ). Vegetation data provide information on the health and vigor of the plant community, and whether vegetative species composition or dominance is being altered due to effluent addition. Water gauge data provide information about hydrology and changes in the depth and duration of inundation. Metals and nutrient data of soils and vegetation determine if there is an accumulation of these materials that could become problematic. Surface water quality data provide information of the efficiency of the system in removing nutrients from the water column. Data are collected from the assimilation wetland and from an ecologically similar reference wetland that is not impacted by the treated effluent. There are typically three monitoring sites in the assimilation wetland that follow the flow of surface water from the discharge of treated effluent to where surface water leaves the wetland (termed Discharge, Mid, and Out sites), along with a reference wetland monitoring site. By comparing data between the assimilation and reference wetlands, as well as pre- and post-discharge data at the assimilation wetland, it is possible to determine if the assimilation wetland is being positively or negatively impacted by effluent addition.
For wetland assimilation systems in Louisiana, typical loading rates for TN and TP range from 2 to 20 g m−2 yr−1 and from 0.4 to 3 g m−2 yr−1, respectively (Day et al., 2019). TP removal of effluent discharged into Louisiana assimilation wetlands ranged from 82 to 93% (calculated as the percent removal between the effluent coming into the wetland and the Out site; Table S1). TN removal in the same wetlands ranges from 85 to 95% (calculated as the percent removal between the effluent coming into the wetland and the Out site; Table S1). Data from assimilation wetlands, stormwater wetlands, and coastal wetlands receiving diverted Mississippi River water show decreasing removal efficiency with increasing nutrient loading for both TN and TP (Figure 3). A large wetland bordering Kolkata, India, has been used to remediate sewage effluent for several decades (Sanyal et al., 2015).
 Fig. 3. TN and TP removal efficiency as a function of loading rate in Louisiana wetlands receiving secondarily treated municipal effluent, stormwater, or diverted Mississippi River water (Hunter et al., 2018).
Removal of nutrients and sediments in non-point source agricultural runoff in adjacent wetlands has been documented for decades (Hunter et al., 2008; Kadlec and Knight, 1996; Lane et al., 2015; Mitsch et al., 2001). Although assimilation wetlands have not been yet specifically used for agricultural drainage treatment, their potential for nutrient reduction could be easily applied for point-source agricultural discharge. Clearly, the loading rate must balance the assimilative capacity of the wetlands. Thus, using natural wetlands would be most effective in areas where wetlands are abundant. Another option is re-conversion of reclaimed wetlands in agricultural fields. In the U.S. Midwest, this is being done in areas where nutrient uptake is optimized. In general, this is in the lowest areas in an agricultural landscape (Mitsch et al., 2001; Boutin and Mitsch, 2021; Kalcic et al., 2018; García et al., 2020).
2.3. Constructed wetlands
CWs, which are artificial systems to treat wastewaters, emerged as a cost-effective solution for agriculture wastewater treatment because of their easy operation and maintenance, and potential for biodiversity improvement (Xia et al., 2020). Nevertheless, due to the highly variable hydraulic loads, temperature and relatively low P concentration, the use of CWs for P removal remains a big challenge (Land et al., 2016; Lu et al., 2009). Reported results from pilot-scale and field trials (Table S2) show highly variable P removal rates from 20% to 80%, where the P concentration in the effluent after treatment is still threatening to the environment (>0.2 mg total P/L) (Bakhshoodeh et al., 2020; Lu et al., 2009; Mendes et al., 2018; Vymazal, 2002). These differences in P removal are most probably related to filtration materials, which could increase P removal efficiency up to 90% (Maehlum and Jenssen, 1998). Therefore, strategies to ensure and increase P sorption and retention in CWs are necessary.
Using phosphorus sorbing materials (PSMs) as filter media to trap dissolved P emerged as a potential approach, as a sole technology or in combination with others. PSMs have been successfully added (i) to the soil of CWs (Ballantine and Tanner, 2010; Blanco et al., 2016), (ii) as filter media of CWs and bed systems (Bauwe et al., 2019; Erickson et al., 2017; Kholoma et al., 2016; Martín et al., 2013; Park and Polprasert, 2008; Vandermoere et al., 2018; Weber et al., 2007) and (iii) using granular PSM in vertical filter units for the treatment of wetland effluents and other streams (Arias et al., 2003; Canga et al., 2016; Pugliese et al., 2020; Shilton et al., 2006; Weber et al., 2007). However, once filtration materials become saturated, wetlands reach P storage capacity and no longer function effectively for P removal. This has been referred to as the ‘aging phenomena’ in wetlands that receive wastewater (Kadlec, 1985). Interestingly, using PSMs with potential to be later applied to agricultural soil would avoid the ‘aging phenomena’. A more detailed description of these technologies is addressed below (section 3. Phosphorus sorbing materials).
2.4. Wetlaculture
Wetlaculture, a term formed by the combination of the words “wetland” and “agriculture”, is a nutrient recycling system that could help solve downstream nutrient pollution problems while decreasing the amount of fertilizers added to landscapes. Between 2016 and 2018 field physical models of replicated wetland mesocosm compounds were established, two in temperate Ohio and one in subtropical south Florida (Figure 4, S1) for estimating the amount of time needed for wetlands to accumulate nutrients before flipping the land to agriculture (Boutin and Mitsch, 2021; Jiang and Mitsch, 2020). Early results show significant nutrient retention by the wetland mesocosms in Buckeye Lake (Ohio) (Jiang and Mitsch, 2020) for 3 years followed by one year of cornproduction with no fertilizer used (Boutin and Mitsch, 2021). In addition, a preliminary business model suggests that farmers and investors could make profits comparable to crops by receiving payment for ecosystem services coupled with public environmental impact bonds sold to investors (Miller, 2021; Miller and Mitsch, 2018).
 Fig. 4. Locations of multi-year wetlaculture mesocosm experiments in Ohio and Florida.
Nonetheless, land-use shift can alter the greenhouse gasses (GHGs) emissions of soil, such as carbon dioxide (CO2), methane (CH4) and nitrous oxide (N2O). For example, the drainage of wetlands to agricultural land or farmland can lead to enhanced emissions of N2O and CO2, while simultaneously decreasing CH4emissions (Ondiek et al., 2021; Smith et al., 2004). Soil NO3 and organic carboncontent are related to CH4 uptake and higher CO2 emissions (Ondiek et al., 2021); therefore, annual evaluations on soil are necessary to indicate which properties potentially drive the GHGs emissions.
3. Phosphorus sorbing materials
Numerous natural, byproducts and man-made materials have been used for P removal from waste streams. After recognizing the largest possible number of described materials for P retention, the following section includes a description of PSMs with the potential to be used as fertilizers or soil amendments when saturated with P. We first review different PSMs and the proposed mechanisms on P removal. For an extensive discussion on PSMs, see Arenas-Montaño et al. (2021), Gubernat et al. (2020) and Vohla et al. (2011).
Materials rich in aluminum (Al), calcium (Ca), iron (Fe) or magnesium (Mg) show a good performance on removal of oxoanions, such as orthophosphate. The presence of these elements enhances P recovery through ligand exchangereactions by Fe or Al based materials and through precipitation by Ca or Mg rich materials (Penn et al., 2017). Other chemical and physical properties, including specific surface area, porosity, particle size distribution and hydraulic conductivity are also important criteria in selecting sorption materials because they also affect the rate and/or capacity of P retention (Dong et al., 2005; Gubernat et al., 2020). Modification of some materials, with heat, crushing or enrichment with Al, Ca, Fe or Mg, has been performed to increase P removal efficiency. Examples of these modifications are mixing of limestone with gypsum and Fe oxides, which resulted in a material, named Filtra P, with a P removal efficiency of 98% (Gustafsson et al., 2008). Heating seashells at a temperature range of 650–800 °C (Currie et al., 2009; Kwon et al., 2004; Lee et al., 2009; Paradelo et al., 2016), waste concrete at 800 °C (Liu et al., 2020a) and opoka at 900 °C (Brogowski and Renman, 2004) oxidizes calcium carbonate into calcium oxide, which increases P removal up to 90% for seashells (Currie et al., 2009; Kwon et al., 2004; Lee et al., 2009; Paradelo et al., 2016), increases concrete waste sorption from 13.3 mg P g−1 to 100 mg P g−1 (Liu et al., 2020a) and from 20 mg P g−1 to 120 mg P g−1 for opoka (Brogowski and Renman, 2004).
When PSM is applied as a fertilizer after being loaded with phosphate, calcium and magnesium rich materials are the primary choices because both ions are macronutrients for plants (Wang et al., 2020), while Al in high concentrations may be toxic for most plants and iron binds strongly with P, making it less bioavailable (Hylander and Simán, 2001).
Struvite and hydroxyapatite are crystalline compounds formed by the precipitation of magnesium and calcium, respectively, with phosphate. Struvite (MgNH4PO4·6H2O) formation occurs in a basic pH environment and with equal molar concentrations of magnesium, ammonium, and phosphate, meaning that it simultaneously recovers N and P from waste effluents (Huang et al., 2014; Muhmood et al., 2019; Rahman et al., 2011). Waste streams are generally low in Mg compared to phosphate and ammonium; hence, the addition of a magnesium source to promote struvite crystallization is often required (Crutchik et al., 2017). The use of low cost ions sources emerged to reduce the operating struvite production costs because the commonly added magnesium salts, such as MgCl2 or Mg(OH)2 (Muhmood et al., 2019; Rahman et al., 2011) can contribute up to 75% of the overall costs (Dockhorn, 2009). Low-cost Mg sources successfully used for struvite formation are seawater (Crutchik and Garrido, 2011) and magnesite. More appealing, Mg-containing waste products, such as brine water, Mg(OH)2 slurry, MgO-saponification wastewater, magnesite dust and wood ash can also be considered as potential options (Al-Mallahi et al., 2020; Crutchik et al., 2017; Heraldy et al., 2017; Lahav et al., 2013; Sakthivel et al., 2012). Apart from Mg dosage, relatively high P concentration (> 50 mg PO4 L−1) are required to ensure the economic viability of struvite precipitation (Dockhorn, 2009).
Hydroxyapatite (HAP, Ca10(PO4)6(OH)2) is the most stable Ca-phosphate precipitate (Valsami-Jones, 2001). It is formed when the molar ratio of PO4concentration to Ca concentration (PO4 /Ca) of the solution is higher than 0.6 (Barca et al., 2014; Barca et al., 2012). To avoid the frequent addition of high-grade solutions as calcium ions source, like CaCl2 (Rugaika et al., 2019), use of calcium rich materials has been favorably adopted for P recover from agriculture streams. Ca-phosphate precipitates occur when Ca ions are dissolved; therefore, materials with relatively high content in soluble Ca forms (mainly calcium oxide, CaO) may have a better performance in phosphate removal from aqueous solutions compared to that of less soluble calcium forms, such as calcium carbonate (CaCO3) (Paradelo et al., 2016).
Furthermore, Ca-phosphate precipitates release phosphate slowly, which is more favorable for reducing the phosphate content in farmland and cropland runoff than soluble chemical phosphate fertilizers (Liu et al., 2019b), and gives these materials the potential to be applied as fertilizers and soil amendments as HAP also slowly releases OH− during the decomposition process, which can adjust the pH of acidic soils (Lee et al., 2010; Liu et al., 2019b; Wang et al., 2020).
Ca-rich waste materials emerged as potential filter material because they are cheap, locally available and have a low environmental impact, minimizing natural resources consumption, saving disposal cost and allowing a P removal approach in accordance to sustainable development. The technology is even more attractive when P can be recycled by using the material saturated with P as soil fertilizer driving the process towards the model of circular economy. Nonetheless, up to now the research has been more focused on materials for P removal instead of studying the feasibility of applying them in agriculture; hence, there is a lack of information regarding to the use of these materials as potential fertilizers. Although the here reviewed materials are considered waste materials, as they are produced as by-products, some of them, may need modifications in order to enhance their P adsorption potential.
Fly ash, steel slag, shells, biochar, concrete and two commercial materials, Polonite® and Filtralite® are Ca-rich materials that have been used as PSMs and suggested as fertilizers and soil amendments. Although these have mostly never been used in treatment of agricultural drainage, outcomes from short term batch experiments, the most abundant tests in literature, long term column and field scale tests prove the significance of using adsorptive materials as substrates to improve (constructed) wetlands removals of P (Table 2) due to their large porous structures and surface area that provides active sites for chemical reactions, resulting in efficient removal (Gubernat et al., 2020; Yi et al., 2012). However, the implementation of these materials in full-scale applications has been limited by several challenges, such as P removal efficiency in the long term, material longevity, maintenance and clogging (Claveau-Mallet and Comeau, 2020). Below a more detailed description of each material is presented.
3.1. Fly ash
The use of fly ash resulting from the combustion of coal (in power plants for example) in wastewater treatment has been studied extensively in recent years and the results of laboratory investigations showed that ashes have an average sorption capacity of 55 mg P g−1 (Table 1). Batch sorption experiments studying P removal from aqueous solutions using fly ashes indicate that main mechanism of P removal is precipitation governed by calcium and ion exchange with Fe and Al related components present in the ashes (Chen et al., 2007). Hermassi et al. (2017) proposed the precipitation of Ca-phosphates via CaO (s) dissolution from the fly ashes as the major P-removal mechanism. Mixture of different materials, such as sand, gravel or concrete with up to 25% of fly ashes increased the removal and retention of phosphate from stormwater runoff by more than 90% (Kandel et al., 2017; Ramsey et al., 2018; Zhang et al., 2008). Outcomes from field scale studies indicate that the mixture of gravel with fly ashes could remove 83% of total P entering in a CW, which was higher than the removal from a CW with gravel alone (22% P removal on average) because of the higher ratio of free surface to volume of fly ashes than that of gravel (He et al., 2007). In addition, the systems could remove organics and nitrogen improving the water quality (He et al., 2007).
Table 1. Performance of the reviewed materials on phosphorus removal efficiency. For the different studies it is indicated the type of water used for experiment, the initial P concentration (C0), sorption capacity (q), P removal efficiency and the scale of experiments. Lab scale refers to experiments conducted under laboratory conditions in batch mode (up to 100 mL vessels), experimental columns (with filtration velocity up to 55 m h−1) and up to 0.1 m3tanks. Pilot scale refers to constructed units of tank volume from 0.2 m3 to 6 m3. Field scale are on-site experiments using real wastewater treatments systems.
| Classification | Material | Water type | C0 (mg P-PO4L−1) | q (mg P g−1) | P removal (%) | Scale | Reference |
|---|---|---|---|---|---|---|---|
| Industrial waste | Fly ash | Synthetic | 2000 | 72.25 | Lab | Garfí and Puigagut, 2016 | |
| Synthetic | 1700 | 56.5 | Lab | Hermassi et al., 2017 | |||
| Synthetic | 500 | 42.55 | Lab | Chen et al., 2007 | |||
| Synthetic | 130 | 72 | Lab | Oguz, 2005 | |||
| Synthetic | 80 | 49 | Lab | Oguz, 2005 | |||
| Synthetic | 1 | 85 | Lab | Zhang et al., 2008 | |||
| Synthetic | 0.3 | 90 | Lab | Ramsey et al., 2018 | |||
| River | 0.13–0.78 | 83 | Field | He et al., 2007 | |||
| Stormwater | 0.12–0.21 | 64–75 | Field | Kandel et al., 2017 | |||
| Steel slag | |||||||
| EAF-slag | Synthetic | 100 | 0.63 | Lab | Barca et al., 2012 | ||
| Synthetic | 50 | 10.21 | Lab | Vu et al., 2021 | |||
| Synthetic | 20 | 2.4 | Lab | Drizo et al., 2006 | |||
| Synthetic | 11–107 | 99 | Lab | Claveau-Mallet et al., 2013 | |||
| Synthetic | 5 | 0.12 | Lab | Barca et al., 2012 | |||
| Synthetic | 5 | – | 85 | Lab | Vu et al., 2021 | ||
| Domestic wastewater | 10.55 | 0.91 | 98 | Pilot | Barca et al., 2014 | ||
| Domestic wastewater | 2.4 | – | 40 | Pilot | Claveau-Mallet and Comeau, 2020 | ||
| CW effluent | 7.8 | 44 | Field | Barca et al., 2013 | |||
| Surface runoff | 0.7 | 45 | Field | Gonzalez et al., 2020 | |||
| Drainage water | 0.01–20 | 55 | Field | Penn et al., 2020 | |||
| Drainage water | 0.7 | 27 | Field | Shedekar et al., 2020 | |||
| BOF-slag | Synthetic | 700 | 9.76 | 55 | Lab | Wu et al., 2021 | |
| Synthetic | 100 | 2.5 | Lab | Barca et al., 2012 | |||
| Synthetic | 5 | 0.14 | Lab | Barca et al., 2012 | |||
| Synthetic | 150 | 14.4 | Lab | Xue et al., 2009 | |||
| Synthetic | 10 | 0.84 | Lab | Xue et al., 2009 | |||
| Synthetic | 100 | 2.47 | Lab | Blanco et al., 2016 | |||
| Synthetic | 5 | 0.12 | Lab | Blanco et al., 2016 | |||
| Domestic wastewater | 10.55 | 1.05 | 99 | Pilot | Barca et al., 2014 | ||
| CW effluent | 7.8 | 58 | Field | Barca et al., 2013 | |||
| Agriculture surface runoff | 12.4 | 0.146 | 94 | Pilot | Park et al., 2017 | ||
| Seashell | Synthetic | 320 | 0.8 | Lab | Dong et al., 2005 | ||
| Synthetic | 50 | 12.8 | 88 | Lab | Nguyen et al., 2020b | ||
| Synthetic | 30 | – | 40 | Lab | Currie et al., 2009 | ||
| Synthetic | 16 | 18.3 | Lab | Paradelo et al., 2016 | |||
| Synthetic | 0.3 | 2.65 | 98 | Lab | Canga et al., 2016 | ||
| Simulated wastewater | 53 | 90 | Lab | Nguyen et al., 2020a | |||
| Digester supernatant | 53 | 11 | Lab | Nguyen et al., 2020b | |||
| Domestic wastewater | 18 | 88 | Pilot | Park and Polprasert, 2008 | |||
| Domestic wastewater | 12 | 98 | Pilot | Lee et al., 2009 | |||
| Tidal river wastewater | 2 | 75 | Field | Luo et al., 2013 | |||
| Agriculture surface runoff | 0–6.3 | 62 | Field | Pugliese et al., 2020 | |||
| Calcined seashell | Synthetic | 50 | 38.7 | 98 | Lab | Nguyen et al., 2020b | |
| Synthetic | 47 | 38.75 | Lab | Paradelo et al., 2016 | |||
| Synthetic | 30 | – | 90 | Lab | Currie et al., 2009 | ||
| Digester supernatant | 53 | 14 | Lab | Nguyen et al., 2020b | |||
| Aquaculture effluent | 0.15 | 0.18 | 60 | Lab | Oladoja et al., 2015 | ||
| Agricultural waste | Biochar | Synthetic | 1000 | 49.95 | Lab | Yin et al., 2019 | |
| Synthetic | 500 | 102.2 | Lab | B. Wang et al., 2020 | |||
| Synthetic | 500 | 48.4 | Lab | Wang et al., 2018 | |||
| Synthetic | 5 | 7.6 | Lab | Jung et al., 2015a | |||
| Synthetic | 16 | 68 | Pilot | Gupta et al., 2016 | |||
| Digester supernatant | 25 | 70 | Lab | Kizito et al., 2017 | |||
| Domestic wastewater | 6 | 93 | Lab | Xing et al., 2021 | |||
| Ca enriched biochar | Synthetic | 1500 | 147 | Lab | Antunes et al., 2018 | ||
| Synthetic | 500 | 314.2 | Lab | Wang et al., 2018 | |||
| Synthetic | 200 | 197 | Lab | Liu et al., 2019b | |||
| Synthetic | 80 | – | >95 | Lab | Dai et al., 2017 | ||
| Domestic wastewater | 18 | 94 | Pilot | Bolton et al., 2019 | |||
| Farm wastewater | 4 | >95 | Pilot | Liu et al., 2019b | |||
| Synthetic | 700 | 16.9 | Lab | Yang et al., 2021 | |||
| Synthetic | 500 | 370 | Lab | Jiang et al., 2018 | |||
| Mg enriched biochar | Synthetic | 500 | 121 | Lab | Li et al., 2016b | ||
| Synthetic | 500 | 82 | Lab | Li et al., 2016a, Li et al., 2016b | |||
| Synthetic | 250 | 66.7 | Lab | Haddad et al., 2018 | |||
| Synthetic | 60 | 138 | Lab | de Carvalho Eufrásio Pinto et al., 2019 | |||
| Synthetic | 31 | 119.6 | Lab | Zheng et al., 2020 | |||
| Synthetic | 31 | 95.5 | Lab | Zheng et al., 2020 | |||
| Synthetic | 30 | >100 | Lab | Yao et al., 2013 | |||
| Synthetic | 240 | 41.3 | 84 | Lab | dos Reis et al., 2020 | ||
| Synthetic | 100 | 13 | Lab | Liu et al., 2020a | |||
| Construction and demolition waste | Concrete | Synthetic | 5 | 18 | Lab | dos Reis et al., 2020 | |
| Synthetic | 100 | 100 | Lab | Liu et al., 2020a | |||
| Synthetic | 20 | 4.96 | Lab | Liu et al., 2020b | |||
| Calcined concrete | Synthetic | 5 | 29.5 | Lab | dos Reis et al., 2020 | ||
| Synthetic | 4.5 | 7.4 | 97 | Lab | Gustafsson et al., 2008 | ||
| Synthetic | 1.4 | 0.2 | 67 | Lab | Karczmarczyk et al., 2016 | ||
| Synthetic | Polonite® | Municipal waste water | 4.1 | 97 | Pilot | Renman and Renman, 2010 | |
| Domestic wastewater | 4.5 | 89 | Field | Renman and Renman, 2010 | |||
| Synthetic | 10 | 0.5 | 54 | Lab | Ádám et al., 2007 | ||
| Biofilter effluent | 7.4 | 95 | Pilot | Jenssen et al., 2010 | |||
| Filtralite® | Effluent from WWTP | 1.6 | 0.4 | 61 | Pilot | Mažeikienė, 2019 | |
| Domestic wastewater | 0.06 | 0.52 | 99 | Pilot | Ádám et al., 2006 | ||
| Domestic wastewater | 0.035 | 0.052 | 97 | Field | Ádám et al., 2006 |
3.2. Steel slag
Steel slag is a major residue from steel production, which its disposal is a worldwide problem. Therefore, it has been reused for a range of purposes, such as for concrete production or road construction in asphaltic pavements (Yi et al., 2012). Steel slag is primarily made of iron and calcium minerals: Fe derives from the raw minerals used to produce steel, whereas Ca derives from the use of fluxing agents (mainly lime) during the steelmaking process. The steel industry produces mostly two types of slag derived from two different steelmaking processes: basic oxygen furnace slag (BOF-slag), which originates from the further refining of iron in a basic oxygen furnace, and electric arc furnace (EAF-slag), a product from melting recycled scrap in an electric arc furnace (Barca et al., 2014; Saliu and Oladoja, 2020).
Both materials have proven effective at removing dissolved P from wastewaters in many laboratory-scale studies (Barca et al., 2014; Blanco et al., 2016; Claveau-Mallet et al., 2014; Han et al., 2015; Weber et al., 2007; Xue et al., 2009) and field trials (Barca et al., 2014; Barca et al., 2012; Gonzalez et al., 2020; Penn et al., 2020; Shedekar et al., 2020). However, while both slags are rich in calcium, they exhibit different ion content, leading to different P removal efficiencies (Table 1). Barca et al. (2014) associated the removal of phosphate by slag with its CaO content and size: P removal increases with high CaO contents and small size slags because the specific surface available for CaO dissolution improves. BOF-slag has a higher CaO content than EAF-slag (Table 2), indicating that P removal efficiency of the first (58%) is higher than that of the latter (44%) (Barca et al., 2012). Nonetheless, results show that both EAF and BOF steel slag could be used as filter media to remove P from the effluent of small WWTPs (95% of total P was removed) (Barca et al., 2014), from surface runoff water (Gonzalez et al., 2020), from the effluent of CWs and from tile drainage. The addition of EAF-slag as filter media improved the removal efficiency of a CW by 75% (Weber et al., 2007) and field scale structures containing EAF steel slag removed on average 43% of dissolved P (Table 1). Claveau-Mallet and Comeau (2020)achieved concentrations below 0.1 mg L−1 of phosphate and 0.3 mg L−1 of TP when using a barrel-shape steel slag filter in recirculation mode fed by the effluent of the second compartment of a septic tank during 275 days. However, the formation of calcite minerals due to the presence of bicarbonate in the water source could result in slag underperformance as CaCO3 would clog the pore structure, which reduces P removal through decreasing interaction between the slag and the water (Penn et al., 2020).
Table 2. Calcium content of reviewed materials.
| Material | Ca content (%) | Reference |
|---|---|---|
| Fly ash | 4–31 | Chen et al., 2007; Hermassi et al., 2017 |
| Steel slag | 20–35 | |
| EAF-slag | Barca et al., 2013, 2012; Penn et al., 2020 | |
| BOF-slag | 34–60 | Barca et al., 2013, 2012; Blanco et al., 2016 |
| Seashell | 40–50 | Lee et al., 2009; Nguyen et al., 2020b; Paradelo et al., 2016 |
| Modified biochar | 20–35 | Dai et al., 2017; Liu et al., 2019a, Liu et al., 2019b |
| Polonite® | 43 | Polonite website, 2021 |
| Filtralite® | 1–2 | Filtralite website, 2021 |
| Concrete | 10–31 | Liu et al., 2020a, Liu et al., 2020b; Wang et al., 2014 |