1. Introduction
Bubble surface loading is a performance indicator of mineral flotation process which depends on the three well-established subprocesses - bubble-particle collision, particle attachment and detachment (Bloom and Heinde, 2003, Sarhan et al., 2016, Sarhan et al., 2018, Mitra et al., 2021, Wang et al., 2022a, Wang et al., 2022b, Schwarz et al., 2022). The rising of particle-laden bubbles to the froth zone is essentially the fourth sub-process before valuable particles can be recovered. Particle-laden bubbles are reported to ascend slower than bare bubbles (Eskanlou et al., 2018a, Wang et al., 2021a), or even descend in flotation columns under extreme surface loading condition (Uribe-Salas et al., 2003). Such reduction in bubble velocity apparently affects the flotation rate. It is therefore important to consider the effect of loaded particles on bubbles to facilitate a more accurate modelling for predicting flotation performance. In-depth understanding of the dynamics of particle-laden bubbles is therefore critical to the recovery of valuable products in mineral flotation.
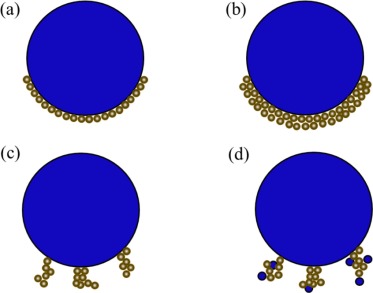
The loading of particles onto bubble surface may result into four distinct outcomes (Omota et al., 2006a): (a) monolayer loading (Fig. 1a) which occurs when particle–particle cohesion forces are negligible compared to the weight of a single particle; (b) multilayer loading (Fig. 1b) which occurs when the particle–particle cohesion forces exceed the particle weight; (c) loading of particle clusters (Fig. 1c) which occurs when the particle–particle cohesion forces further increase but the weight of the cluster is still smaller than the adhesion force between particle and bubble. Further increase in particle–particle cohesion forces through surface hydrophobicity may lead to formation of larger particle clusters which are unable to adhere to bubbles; (d) the loading of particles-small-bubbles clusters (Fig. 1d) which involve small size bubbles comparable to particles. It is noted although a limited number of studies (Omota et al., 2006a, Zhang et al., 2012) briefly discussed a more complex multilayer loading behaviour, most of the research studies (Wang et al., 2019a, Yan et al., 2021) focused on the monolayer loading behaviour with intention to lay foundation for multilayer loading theory.
 Fig. 1. Schematic of the four types of particles loading onto a bubble surface: (a) monolayer loading; (b) multilayer loading; (c) loading of particle clusters; (d) loading of particles-small- bubbles clusters.
In the monolayer loading scenario, bubble surface loading (BSL) is defined as the fraction of the bubble surface area occupied by the loaded particles to the whole surface of the bubble (Sarkar et al., 2011, Wang et al., 2019a). A flotation cell or column may feature a distribution of bubble surface loading which can be attributed to the presence of different hydrodynamic conditions in the cell (Uribe-Salas et al., 2003, Koh and Schwarz, 2007, Eskanlou et al., 2018b).
In quiescent liquid, a bubble can be fully loaded with particles implying bubble surface loading can reach unity (Gallegos-Acevedo et al., 2006, Yan et al., 2021). On contrary, in presence of a background flow condition, bubble surface loading is rarely reported to reach unity (Bradshaw and Connor, 1996, Koh and Schwarz, 2007, Koh and Schwarz, 2008). There exists a maximum BSL which decreases with increasing energy input to the system i.e. impeller speed in mechanical flotation cell (Wimmers and Fortuin, 1988) and may only reach up to 0.12 (Bradshaw and Connor, 1996). As experimentally observed by Wimmers and Fortuin (1988), bubble loading capacity can be exhausted once the maximum surface loading is reached. Effect of flow field on maximum BSL is not well understood due to the complex interactions between the bubbles, particles and turbulent flow structures (Eskanlou et al., 2019, Wang et al., 2019a). Physical properties of particles (size, density, and surface hydrophobicity) and aqueous medium (density, viscosity, surface tension) also affect the surface loading parameter which have not been studied at depth.
To address these knowledge gaps, this review first presents the current practices to measure bubble surface loading and carefully considers different operating conditions that govern this parameter. Next, the coalescence behaviour of particle-laden bubbles is reviewed which critically determines froth stability in mineral flotation process. Finally, the motions of particle laden bubbles specifically focusing on the rise velocity and drag coefficient were reviewed with emphasis on the modification of drag coefficient accounting for surface loading.
2. Implication in flotation recovery
Bubble surface loading is a critical parameter that governs product recovery in mineral flotation. Depending on whether particle-laden bubbles attain the maximum bubble surface loading, product recovery can be generally classified into zero-order and first-order kinetics. Zero-order kinetics refer to a scenario wherein exhaustion of bubble loading capacity occurs upon reaching maximum BSL (Heiskanen, 2013). It is noted that for simplicity, most studies in the literature assume bubble surface loading remains less than the maximum BSL such that bubbles can carry loaded particles to froth phase (Jameson and Young, 1977, Yoon and Mao, 1996). Flotation recovery in this case essentially follows a first-order kinetics, which can be determined using the following expression (Wang et al., 2020a):(1)where is bubble velocity, is bubble radius, is gas volume fraction, ,, and are collision, attachment and detachment efficiency respectively, and is flotation time.
Some earlier studies considered the bubble velocity same as superficial gas velocity, which is determined by diving the gas flow rate by the cross-sectional area of flotation cell (Jameson and Young, 1977, Yoon and Mao, 1996). It however needs to be noted that superficial gas velocity does not truly represent the rising bubble velocity in a flotation unit as bubbles reach different terminal rise velocity depending on their size and surface loading. A more general approach is to consider in Eq. (1) as bubble slip velocity calculated from the terminal rising velocity (Ngo-Cong et al., 2018). This approach however does not consider the effect of bubble surface loading on rise velocity, nevertheless, a series of past studies suggest reduction in bubble rise velocity with increased level of surface loading (Eskanlou et al., 2019, Wang et al., 2019a, Wang et al., 2019b, Wang et al., 2021a, Yan et al., 2021). The use of rise velocity of a bare bubble in Eq. (1) therefore always overestimates recovery.
In a recent study (Wang et al., 2020a), the effect of bubble surface loading has been accounted in a flotation recovery model by batchwise injection of bubbles at each timestep into the pulp phase having max. solids concentrations of ∼ 1.84%. Discrete staircase jumps in the predicted recovery can be observed in Fig. 2 when solids concentration is increased implying bubble-particle interactions at each timestep as the system goes through the loading regime before reaching a plateau at the maximum BSL (saturated regime). Noticeably, as the solid concentration decreases, recovery rate increases, and such “staircase” patterns disappear due to quick removal of particles from pulp phase as more bubbles are present in the system compared to solid particles. Under such circumstances, bubbles are under-utilised as surface loading cannot reach its maximum value within the available bubble residence time in the system.
 Fig. 2. Recovery profile for three different solids concentration at Ti = 0 in a semi-batch flotation process. Reprinted from (Wang et al., 2020a), Copyright, with permission from Elsevier.
Although Wang et al. (2020a) applied a simplified drag model to predict the rising velocity of particle-laden bubbles, it can still be concluded that role of bubble surface loading in recovery cannot be ignored. The first step in examining the effect of bubble surface loading in flotation is to quantify this parameter. Several methods are reported for BSL measurement in the literature which are briefly reviewed in the following section.
3. Bubble surface loading and measurement methods
3.1. Bubble surface loading methods
Depending on the investigation purpose, bubble loading methods can be classified into two primary categories - loading in static or no-flow condition (Vinke et al., 1991a, Omota et al., 2006a, Zhang et al., 2012, Spencer et al., 2012) and loading in a dynamic flow condition (Falutsu and Dobby, 1992, Sarkar et al., 2011, Huang et al., 2011, Chegeni et al., 2016, Wang et al., 2019a, Wang et al., 2021a, Yan et al., 2021).
The first approach is used to examine the relationship between the maximum bubble surface loading and particle properties. This relationship was first studied by Wimmers and Fortuin (1988) who applied the “Pick-up” method earlier developed by Lee (1969). In this approach, a bubble attached to a syringe needle is moved towards a packed bed of particles (Fig. 3a). A bubble is immersed into the particles to allow particles to adhere to bubble surface. The syringe is then retracted upwards to determine the BSL (discussed in detail in section 3.2). It should be noted that this method may not be useful for strong hydrophobic particles due to strong adherence to particles to each other which makes it difficult for a bubble to penetrate a packed bed.
 Fig. 3. Schematic of bubble loading method in the stagnant liquid: (a) Bubble Pick-up method. Reprinted from (Wimmers and Fortuin, 1988), Copyright, with permission from Elsevier; (b) Top-loading method; (c) Fluidised-bed-loading method. Reprinted from (Ireland and Jameson, 2014), Copyright, with permission from Elsevier; (d) Suspension-loading method. Reprinted from (Xia et al., 2018), Copyright, with permission from Elsevier.
An alternative loading method is “top loading” which allows to load a bubble in a controlled manner to study the rising dynamics of particle-laden bubble with certain BSL (Eskanlou et al., 2018a) or to investigate the particle–particle arrangement patterns in the loading region (Gallegos-Acevedo et al., 2006). In this method, particles are released by a screw feeder which penetrate the free gas–liquid surface and gently settle onto a bubble surface (Fig. 3b). Bubble loading or particle deposition precision can be substantially improved by replacing the spatula with a variety of particles feeders (Nguyen and Evans, 2004, Wang et al., 2021a, Yan et al., 2021) (discussed in section 5.1). Although the top-loading method has been widely used in examining the dynamics of particle-laden bubbles, it is reported that strong hydrophobic particles may form agglomerates at the free air–liquid surface (Zhu et al., 2020) increasing the risk of the feeding tube to clog up. Therefore, particle hydrophobicity should be carefully chosen for this method.
Fluidised bed loading is another method which has been applied by Ireland and Jameson, 2014, Goel and Jameson, 2012 to generate particle-laden bubbles (Fig. 3c). In this method, water is introduced evenly into the bottom of the column via a porous sparger in order to fluidize the bed. Bubbles are then injected through a capillary tube at the bottom of the bed. As bubbles rise, they collide with the surrounding particles and load particles onto their surface. The merit of this method is its zero-blockage feature compared to the top-loading method however has an obvious limitation to load bubbles to a desired level of surface coverage.
The suspension loading method (Fig. 3d) has also been reported in literature (Xia et al., 2018, Wang et al., 2019a). In this method, a uniform suspension of hydrophobic particles is produced in a tank by a magnetic stirrer spinning at the tank bottom. A bubble is then generated at the tip of an immersed capillary tube or a nozzle entering the tank from top or sideways allowing its surface to be gradually covered in contact with surrounding particles. The stirrer is turned off once the desired degree of bubble surface loading is obtained.
The dynamic approach which involves a flow condition, is suitable to quantify bubble surface loading in flotation systems (Bradshaw and Connor, 1996, Eskanlou et al., 2018b, Eskanlou et al., 2018c, Hassas et al., 2021). In this case, bubbles are loaded with particles while rising through a pulp phase (particle suspension) in a column (Fig. 4a). The particle-laden bubbles are then deflected off the cone at the top into a particle collector. The mass and sizes of collected particles are used to calculate the bubble surface loading level. This method quantifies bubble surface loading in actual flotation condition and has been adopted by many researchers (Bradshaw and Connor, 1996, Huang et al., 2011, Chegeni et al., 2016). Details of the bubble surface loading profiles in flotation systems are discussed in section 3.2.
 Fig. 4. Schematic of experimental setup to determine the bubble surface loading in flowing liquid: (a) particle-laden bubble rising in flotation column. Reprinted from (Bradshaw and Connor, 1996), Copyright, with permission from Elsevier; (b) particle-laden bubble held stationary with downward flowing slurry. Reprinted from (Vinke et al., 1993), Copyright, with permission from Elsevier.
Alternatively, bubbles can be loaded using the pick-up method described in Fig. 3a and then held stationary in a flow environment (Fig. 4b) to determine the maximum BSL. In this case, a flow enters the tank through the inlet and ascends to the top of the tank wherein it is deflected downwards towards a stationary particle-laden bubble (Vinke et al., 1993). The transparent system allows the bubble loading process to be captured by a camera and quantify the surface loading level through suitable image processing (details discussed in section 4). In the following section, various methods available for quantifying bubble surface loading level using bubble sampler are briefly discussed.
3.2. Bubble surface loading: Measurement methods
3.2.1. Optical method
Optical method is widely applied in the transparent systems where bubble surface loading process can be directly captured by a high-speed camera and suitable postprocessing (Wimmers and Fortuin, 1988, Huang et al., 2011, Wang et al., 2021a), as shown in Fig. 5. Based on the assumption of a spherical shape, the clean angle , defined as the angle between the vertical axis of the bubble and the position vector from the bubble centre to the highest loaded particle, can be measured from the captured image. Using the measured clean angle, the bubble surface loading can be calculated as follows (Wimmers and Fortuin, 1988):(2)
 Fig. 5. Optical method of measuring bubble surface loading: (a) Schematic of angle measurement of the particle-laden bubble. Reprinted from (Huang et al., 2011), Copyright, with permission from Elsevier; (b) Curving fitting of the particle-laden bubble pendant. Reprinted from (Wang et al., 2019a), Copyright, with permission from Elsevier.
Optical method can be applied to detect the level of bubble surface loading of a particle-laden bubble pendant (Wang et al., 2019a), as shown in Fig. 5b. The loading point L is identified first and then the region free of particles on bubble surface extracted and used to fit into the pendant drop model (Yang, et al., 2018). The surface area of the bubble pendant and the loaded surface area are calculated by numerically integrating the area by 360° rotation of the pendant curves AB and LB, respectively. Bubble surface loading then can be calculated as the ratio of the surface area occupied by particles to the entire surface area of the bubble , as given below:(3)
The algorithm used for calculation of BSL in Eq. (3) can also be applied to the ellipsoidal bubbles (Wang et al., 2021a) since the ellipsoidal assumption of bubble shape is more realistic compared to bubble pendant for bubbles of diameter larger than 1 mm..
3.2.2. Acoustic method
Due to high concentration of particles and bubbles in practical flotation systems, the pulp phase is usually opaque which limits the application of the optical method. An alternative in such case is using an acoustic method which is not limited by opacity of a system. In this method, a particle-laden bubble is stimulated by an acoustic transducer and resonated at its natural frequency. The acoustic resonance frequency or Minnaert frequency (Minnaert, 1993) of a bubble decreases with an increase in the mass of loaded particles on bubble surface and can be conveniently correlated to the bubble surface loading parameter.
Stimulation of a bubble with an acoustic wave leads to periodic oscillations at interface due to competition between a surface deforming acoustic pressure force and the restoring surface tension force. Such oscillations are large when resonance frequency is reached which could be identified as peaks in the power spectral density shown in Fig. 6b. Using the resonance frequency in the conservation of kinetic energy of an oscillating particle-laden bubble system in liquid with the potential energy of gas inside the bubble, mass of loaded particles can then be calculated as follows (Zhang et al., 2012):(4)where = mean radius between the centre of bubble and of the loading region as shown in Fig. 6a, = particle density, = ratio of the density of the attached particle-laden bubble to the density of liquid. = volumetric fraction of particles in the particle-laden bubble, and = resonance frequency for the bubble before and after loading. For low-density particle loading, = 1 while for high-density particle loading, = . In the case of multilayer loading, Zhang et al. (2012) reported that the mass of loaded particles can be determined as:(5)
 Fig. 6. (a) Schematic of particle-laden bubble in liquid; (b) Power spectral density of acoustic stimulus and received response. Reprinted from (Zhang et al., 2012), Copyright, with permission from Elsevier.
Referring to Fig. 6a, and assuming a spherical shape, bubble surface loading can be calculated as follows:(6)where the number of particles is expressed as:(7)
For a single bubble, setting to unity, and combining Eqs. (6), (7) results in:(8)
In practice, the acoustic method has been tested on the downcomer region of an industrial-scale Jameson cell (Spencer et al., 2012) where the resonance frequency in Eq. (5) was recorded by hydrophones and accelerometers to measure the bubble surface loading parameter. The key issue here specific to industrial applications is the rapid decay of after bubble formation which limits the use of this method in the vicinity of bubble generation region. The recorded varies with the rate of aeration, slurry feed, frother and collector addition. Despite these findings, bubble surface loading was not reported in Spencer et al. (2012) due to the lack of information of bubble radius and number of bubbles. Besides, the group effect of bubble swarms on was not been accounted in this method. These inherent shortcomings limit the application of the acoustic method in the prediction of BSL value in practice (Zhang et al., 2012).
3.2.3. Bubble surface loading sampler
An alternative and widely applied method to identify the bubble surface loading level in opaque flotation systems involves using a bubble surface loading sampler (see Fig. 7). A typical bubble sampler comprises a sampling tube which is placed at the targeted sampling points in a flotation system to allow particle-laden bubbles continuously enter the sampler. Particle-laden bubbles then rise into the sampling tube and collapse at the top of a collection tank. The number of bubbles risen into the sampler can be calculated based on the volume of the displaced water from the broken bubble in the tank as follows:(9)
 Fig. 7. Direct method of measuring bubble surface loading: (a) Measurement of bubble diameter and (b) Bubble surface loading sampler (Ostadrahimi et al., 2019). Open access.
As bubbles collapse, particles detach from the bubbles and settle down to the bottom of the tank and are collected later to measure the particles weight . Combining Eqs.(6), (7), (9), the bubble surface loading parameter can be written as:(10)
To determine the bubble diameter in Eq. (10), a separate bubble sampling system is usually applied wherein the particle-laden bubbles enter into a transparent viewing chamber. Bubbles are then photographed by a camera in shadowgraphy mode using back lighting followed by appropriate image processing algorithm to determine the bubble size (see Fig. 7a).
The capability of measuring bubble surface loading in opaque systems has made the BSL sampler quite popular in the past three decades. Appropriate cautions however must be taken to minimise the entrainment of particles into the wakes of bubbles as particle-laden bubbles rise into the sampler. Additionally, detachment of coarse particles from the bubble surface may also occur during the sampling procedure. A variety of bubble loading samplers have been developed and improved over time to avoid such unwanted entrainment and detachment events which are briefly discussed in the following section.
3.2.4. Development of bubble surface loading sampling devices
Falutsu and Dobby (1992) developed the first bubble loading sampler, as shown in Fig. 8a, to analyse the particle loading behaviour in the froth phase. In this arrangement, the sampling tube is placed at the targeted location from where a bubbly liquid sample can be withdrawn by two peristaltic pumps connected to position 1 and 3. Wash water is applied at position 2 to reduce the particle entrainment, so pump 2 only collects the particles attached to bubbles. The expansion chamber at position 1 allows pump 1 to collect particles entrained in the liquid.

 Fig. 8. A summary of bubble surface loading sampler applied in flotation system. (a) Reprinted from (Falutsu and Dobby, 1992), Copyright, with permission from Elsevier; (b) Reprinted from (Bradshaw and O’Connor, 1996), Copyright, with permission from Elsevier; (c) Reprinted from Dyer (1995). Copyright by the University of Witwatersrand. Reprinted with permission; (d) Reprinted from (Seaman et al., 2004), Copyright, with permission from Elsevier; (e) Reprinted from (Moys et al., 2010), Copyright, with permission from Elsevier; (f) Reprinted from (Rahman et al., 2013), Copyright, with permission from Elsevier; (g) Reprinted from (Bhondayi and Moys, 2011), Copyright, with permission from Elsevier; Inset in Fig. g, Open access.
Compared to the flotation test which non-selectively collects all particles in the froth, this measurement approach decouples the dilemma of distinguishing particles loaded on a bubble and entrained in the liquid. However, to wash off the entrained particles in the pumped liquid, the liquid bias velocity needs to be kept much higher (as high as ten times) than the superficial gas velocity. Consequently, particle detachment in bubble sampler may occur in the downward directed high shear flow and ascent of fine bubbles may be supressed. It should be noted this bubble sampler does not examine the number of bubbles and therefore can only be used to analyse the grade of particles loaded onto bubble. This simple design provided much guidance to the other samplers that were developed later (Dyer, 1995, Seaman et al., 2004, Moys et al., 2010).
An alternative bubble loading sampling device (Fig. 8b) which allows particle-laden bubbles to self-rise due to buoyancy rather than being pumped, was developed by Bradshaw and Connor (1996) to determine bubble surface loading in a micro-flotation cell. In this arrangement, all particle-laden bubbles ascend across the cell and rise into the sampler, and air flowrate and bubble size are measured This sampling device is particularly useful for measuring bubble surface loading even if the flotation cells do not have any froth zone.
The features of self-rising bubbles, and de-entrainment of particles were combined in a novel bubble loading samplers developed by Dyer, 1995, Seaman et al., 2004 as shown in Fig. 8c and Fig. 8d. In this system, particle-laden bubbles rise through the sampling tube into a collection chamber and collapse at top of the chamber. Particles from bubble surface detach and settle down at the bottom of the chamber. The liquid volume displaced by the air bubbles goes through a side-channel (Fig. 8c) or directly flow downwards in the sampling tube (Fig. 8d), generating a positive displacement condition to wash the entrained particles from the particle-laden bubbles. In Fig. 8c, the downward flow exits the sampling tube sideways to enable fine bubbles enter the sampling tube. The sideway exit however leads to excess liquid and bubbles entering the sampling tube, lowering the precision of the bubble loading measurement at the targeted location. This drawback was improved by Moys et al. (2010) by using converging nozzles and reducing the nozzle size, as shown in Fig. 8e. The modified sampling device was later used by several researchers (Yianatos, et al., 2015; Ostadrahimi et al., 2019) with reasonable reproducibility.
Bhondayi and Moys (2011) examined the relationship of axial mixing performance in the riser (namely the sampling tube) and the diameter of the riser using a specially designed bubble loading sampler device (see Fig. 8g). The possibility of fine particles which detach from the bubble going back into the flotation cell in bubble loading sampler in Fig. 8c – e is prevented by using a filter before the displaced water goes back into the cell. Axial mixing increases with increase in the diameter of riser and causes the entrained particles attach to bubbles. A sampler in the diameter range from 20 to 30 mm has been found to be adequate to measure bubble loading. This device with the optimum riser diameter, was also applied by Eskanlou et al. (2018b) on a flotation column to measure the axial bubble surface loading. The oscillation-buffering collection chamber shown in Fig. 8g was however excluded for easy operation.
A novel bubble loading sampler suitable for industrial flotation cells was reported by Rahman et al. (2013) which is shown in Fig. 8f. This sampler design consists of two concentric tubes with the outer tube allowing rising of the particle-laden bubbles into the froth region and the inner tube directing the particles which drop back from the froth to the pulp phase into a collection chamber. Although this sampler is used to examine froth recovery (defined as the ratio of particles reported to the concentrate via true flotation to that of particles entering the froth phase), it can also be interpreted as a way to identify bubble loading across the pulp-froth interface.
A chronological review of the available studies on bubble surface loading measurement is presented in Table 1.
Table 1. Measurement of bubble surface loading parameter.
| Reference | System | Measurement method | Original parameters | Converted BSL in dimensionless unit |
|---|---|---|---|---|
| Wimmers and Fortuin (1988) | bubble pick-up apparatus (∼0.4 – 0.8 mm, ∼ 5 – 10 µm, ∼ 1800 – 4527 kg/m3) | Optical | ∼ 0 – 90, deg | 0 – 0.50, - |
| Vinke et al.(1991a) | bubble pick-up apparatus, contact angle ∼ 5 deg (∼0.70 – 1.10 mm, ∼ 16 – 76 µm, ∼ 2280 – 4370 kg/m3) | Optical | ∼ 0 – 117, deg | 0 – 0.73, - |
| Falutsu and Dobby (1992) | flotation column | BSL sampler | 0 – 0.072, g/(ml air) | – |
| Bradshaw and Connor (1996) | flotation cell (∼1.24 mm, ∼ − 38 - +150 µm, ∼ 5040 kg/m3) | BSL sampler | ∼ 25 – 1281 | 0 – 0.14, - |
| Uribe-Salas et al. (2003) | Bubble loaded while rising in downward slurry in flotation column, slurry velocity > 0.7 cm/s, solid concentration ∼ 15 – 35% (∼190 µm, ∼ 2650 kg/m3) | Optical | BSL ∼ 1.00, - | 1.00, - |
| Seaman et al. (2004) | In flotation cell or column, solid is a mixture of Mgo, galena, sphalerite, pyrite and gangue | BSL sampler | 31 g/L | – |
| Omota, et al. (2006a) | Analytical modelling of BSL for bubble pick-up method (∼1.0 mm, ∼ 200 µm, ∼ 1374 kg/m3) | Optical | = 0 – 180, deg | 0–0.50, - |
| Omota, et al. (2006b) | bubble pick-up apparatus, contact angle ∼ 5 deg (∼0.364 – 1.20 mm, ∼ 22 – 44 µm) | Optical | = 0 – 180, deg | 0–0.50, - |
| Gallegos-Acevedo et al. (2006) | Bubble loaded by particles feed from top before rising (∼2.10 – 5.00 mm, ∼ 190 µm, ∼ 2560 kg/m3) | Optical | BSL ∼ 1.00, - | 1.00, - |
| Koh and Schwarz (2008) | Numerical simulations of particle recovery based on three sub-process, solid concentration 4% (∼2.00 mm, ∼ 10 – 200 µm, ∼ 2600 kg/m3) | Numerical modelling | BSL ∼ 0.20, - | 0.20 |
| Huang et al. (2011) | Bubble loaded while rising through stationary pulp, contact angle ∼ 44 deg (∼0.59 – 1.15 mm, ∼ 22 µm, ∼ 2650 kg/m3) | BSL sampler | ∼ 0 – 137, deg | 0 – 0.11 for ∼ 1.15 mm, 0 – 0.41 for ∼ 0.59 mm. |
| Sarkar et al. (2011) | In flotation cell, contact angle ∼ 59 deg solid concentration ∼ 5% − 20% (∼0.042 mm, ∼ 3.10 – 14.7 µm, ∼ 2650 kg/m3) | BSL sampler | 0 – 0.35, - | 0 – 0.35, - |
| Zhang et al. (2012) | Bubble loaded by particles feed from top (∼1.10, 1.78 mm, ∼ 115 µm, ∼ 2200 kg/m3) | Acoustic | ∼ 0 – 90, deg | 0 – 0.5, - |
| Spencer, et al. (2012) | In flotation cell, solid concentration 4 – 12% (∼0.54 – 0.72 mm, ∼ 300 µm, ∼ 2200 kg/m3) | Acoustic | BSL ∼ 0.80, - | 0.80, - |
| Chegeni, et al. (2016) | In flotation column, solid concentration 10% (∼1.6 – 4.0 mm, ∼ 63 – 150 µm, ∼ 2500 kg/m3) | BSL sampler | ∼ 0.0188–0.0434 mg/mm2 | 0.06 – 0.19, - |
| Eskanlou et al. (2018a) | Stationary bubble loaded by particles feed from top (∼2.6 – 4.0 mm, ∼ 150 – 300 µm, ∼ 2650 kg/m3) | Optical | BSL ∼ 0, 1.00, - | 0, 1.00, - |
| Eskanlou et al., 2018b, Eskanlou et al., 2019 | Bubble loaded while rising in flotation column contact angle ∼ 12 – 80 deg (∼0.90 – 1.80 mm, ∼ 63 – 300 µm, ∼ 2500 – 6960 kg/m3) | BSL sampler | ∼ 0.0027–0.0043, mg/mm2 | 0.03 – 0.31 |
| Ostadrahimi, et al. (2019) | In flotation cell (∼0.72 – 1.96 mm, ∼ 80 – 108 µm, ∼ 3940 kg/m3) | BSL sampler | ∼ 0.0027–0.0043, mg/mm2 | 0.03, - |
| Wang et al. (2019a) | Bubble loaded by the settling of previously magnetic bar –stirred particles (∼2.4 – 2.5 mm, ∼ 64 µm, ∼ 2500 kg/m3) in pure water | Optical | BSL ∼ 0 – 0.60, - | 0 – 0.60, - |
| Wang et al. (2019b) | Bubble loaded by the settling of previously magnetic bar –stirred particles (∼3.2 – 3.6 mm, ∼ 64 – 266 µm, ∼ 2500 kg/m3) in pure water | Optical | BSL ∼ 0.5, 1.0, - | 0.5, 1.0, - |
| Wang et al. (2021a) | Bubble loaded by glass beads fed from top in pure water and in SDS surfactant (∼2.76, 3.34 mm, ∼ 114 µm, ∼ 2450 kg/m3, SDS concentration: 58 ppm) | Optical | BSL ∼ 0 – 0.59, - | 0 – 0.59, - |
| Yan et al. (2021) | Bubble loaded by particles feed from top in pure water (∼2.76 – 3.83 mm, ∼ 58 – 196 µm, ∼ 1200 kg/m3) | Optical | BSL ∼ 0 – 1.0, - | 0 – 1.0, - |
| Wang and Brito-Parada (2022) | Bubble loaded by the settling of previously magnetic bar –stirred particles (∼3.10 – 3.40 mm, ∼ 39 µm, ∼ 2500 kg/m3) in pure water | Optical | Particle loading area, 0 – 30.1 mm2 | – |
| Chen et al. (2023) | A particle preplaced on supporting frame and is loaded onto the bubble as the bubble grows in various viscous liquids (∼0.55–1.28 mm, ∼ 1113 kg/m3) | Optical | Single particle loading | – |
The bubble surface loading is quantified using three parameters namely − 1) loading angle or the supplementary angle of (see Fig. 5a); 2) number of loaded particles per bubble, and 3) weight of particles loaded per unit bubble surface area, (mg/mm2). For comparison purpose, the reported BSL in different units are converted as the ratio of the bubble surface area occupied by the loaded particles to the whole surface of the bubble. The mathematics of the conversion is illustrated in Table 2.
Table 2. Different form of BSL parameters.
| Original parameters | Converted BSL |
|---|---|
| , deg | , - |
| , deg | , - |
| , number of particles per bubble | ,- |
| , mg/mm2 | ,- |
It can be noted that bubble surface loading (BSL) parameter presented in Table 1varies with the types of flotation cell, operating conditions (air and liquid velocities, aqueous medium chemistry) and physical properties of bubbles and particles. It has been reported that bubble surface loading decreases with increase in gas flow rate due to creation of large interfacial area (Falutsu and Dobby, 1992, Sarkar et al., 2011). Additionally, bubble surface loading in flotation is also related to collector dosage which increases particle hydrophobicity (Eskanlou et al., 2018c). In a typical flotation cell, bubble surface loading decreases along the radial direction away from the central axis of the cell close to the froth region (Falutsu and Dobby, 1992, Koh and Schwarz, 2007) as shown in Fig. 10.
 Fig. 10. CFD-predicted percentage of bubbles loaded with particles in a mechanical flotation cell. (Reprinted from (Koh and Schwarz, 2007), Copyright, with permission from Elsevier).
Bubble surface loading increases along the height of flotation cells as bubbles ascend and collect particles (King et al., 1974), suggesting the dynamic nature of the BSL parameter in flotation process. Eskanlou et al. (2020) further reported that a taller particle collection zone is required in flotation columns for collecting finer particles because it takes longer for these particles to reach the maximum bubble surface loading.
It can also be concluded from Table 1 that bubbles in quiescent systems can be fully loaded (BSL = 1) while in practical flotation cells which often feature a turbulent flow condition, BSL values are reported to be much lower at ∼ 0.2 (Bradshaw and Connor, 1996, Koh and Schwarz, 2008, Huang et al., 2011, Chegeni et al., 2016). This discrepancy indicates that turbulent interactions between a particle laden bubble and the surrounding fluid must be considered for a realistic estimate. Maintaining an appropriate turbulence condition in flotation systems is of paramount interest to maximize the bubble surface loading hence product recovery without unnecessarily increasing the particle detachment efficiency. In the following section, some relevant theoretical aspects related to modelling of the maximum bubble surface loading (BSLmax) in both stagnant and flowing conditions are briefly addressed.
4. Maximum bubble surface loading: Theoretical estimation
For a stationary bubble with a monolayer surface loading configuration in a quiescent system, the bottom most particle located at the south pole of the bubble is subjected to the maximum cohesive force exerted by all particles above it (Omota et al., 2006a, b). Therefore, the maximum bubble surface loading criterion is met when the net force exerted on the particles at bubble south pole reaches zero (Omota et al., 2006a, Eskanlou et al., 2019).
To formalize this criterion, a force analysis on the bottommost particle can be performed. In Fig. 9a, the bottommost particle (particle 5) experiences the following forces namely a) gravity force ; b) buoyance force , where is equivalent to in Fig. 9c; c) capillary force ; d) capillary pressure force ; and e) the cohesive force .
 Fig. 9. Schematic of vertical cross section of a particle-laden bubble: (a) different parameters to represent bubble surface loading; (b) monolayer loading, reprinted from (Vinke et al., 1991b), Copyright, with permission from John Wiley & Sons; (c) a cluster of loaded particles, Reprinted from (Vinke et al., 1991a), Copyright, with permission from Elsevier.