Highlights
-
•
Catalytic pyrolysis significantly reduces the graphenization temperature of biomass.
-
•
Metal carbides are crucial intermediate phases during graphenization.
-
•
Hydrothermal pre-treatment allows an energy saving of 85% in pyrolysis.
-
•
Fast solar pyrolysis promotes graphene layers growth and flattening in biocarbon.
-
•
Energy assessment highlights significant energy savings of graphenization processes.
Abstract
Reducing energy consumption and environmental impact in the graphenic material production is of foremost importance. While using lignocellulosic biomass is gaining momentum, processing such a non-graphitizable resource is energy consuming as it requires a thermal treatment above 2000 °C. Three alternative carbonization routes are analyzed: catalytic, hydrothermal pre-treatment and solar. We discuss the sustainability of the biocarbon production as compared to conventional high temperature biomass carbonization. The mechanisms of carbonization and graphenization is unveiled using a variety of characterization methods from macroscopic to nanoscopic scale. In catalytic graphenization, it is showed that metal carbides play a crucial role as intermediate phases in the graphenization mechanism. Solar-driven pyrolysis focused intense radiative flux resulting in an improve of the growth and flattening of graphene layers in biocarbon. For each process considered, the operating conditions can finely be tuned to control the graphenization degree, and successfully convert non-graphitizable lignocellulosic biomass into graphenic biocarbon. This review provides new insights on mechanisms in relation to the energy and environmental assessment. For calcium-doped biomass we estimate an energy saving of 22 % when working at 1600 °C compared to carbonization of raw biomass at 2000 °C attributed to the formation of calcium carbide around 1300 °C. Hydrothermal pre-treatment provides a carbon pre-structuration which could save up to 85 % of pyrolysis energy input by lowering the graphenization temperature to 1200 °C, while solar pyrolysis consumes half the energy as compared to the conventional one. This drastically reduces the environmental impact of the biocarbon production.
Graphical abstract

Keywords
Biocarbon
Carbonization
Graphenization
Catalyst
Structuration and pre-structuration
Energy assessment
Nomenclature
Abbreviations
- 3D
-
Three dimensional
- BSU
-
Basic Structural Unit
- EDS
-
Energy-dispersive X-ray spectroscopy
- HRTEM
-
High-resolution transmission electron microscopy
- HTC
-
Hydrothermal carbonization
- IRR
-
Internal rate of return
- LCA
-
Life cycle assessment
- LCI
-
Life cycle inventory
- LCIA
-
Life cycle impact assessment
- LMO
-
Local molecular orientation
- MDF
-
Medium-density fiberboard
- NMR
-
Nuclear magnetic resonance
- NVP
-
Net present value of profit
- PBT
-
Payback time
-
Pair diffusion function
- ROI
-
Return on investment
- SAED
-
Selected area diffraction
- TEA
-
Technical and economic analysis
- TEM
-
Transmission electron microscopy
- XPS
-
X-ray photoelectron spectroscopy
- XRD
-
X-ray diffraction
Symbols
- Cp
-
Specific heat
- d002
-
Interlayer spacing in graphite
- g
-
Graphitization degree
- H
-
Enthalpy
- k0
-
Thermal conductivity
- La and Lc
-
Dimensions of graphite crystallite (in plane and stacking)
- Qp
-
Heat
- R0
-
Severity factor
- ρ
-
Electrical resistivity
- σ
-
Electrical conductivity
1. Introduction
Biocarbons (or biochars) are carbon-rich materials obtained from bioresources thermoconversion [1]. The biocarbon properties varies depending on the original biomass feedstock, the process and the operating conditions. Considering the current environmental crisis, this versatile and renewable material is of prime interest for environmental remediation [2], electrical energy storage [3] or biopolymer composites production as an alternative to conventional plastics [4]among others. These applications are based on the high graphitic yield in biocarbon, in other words, the degree of carbon structuration. The structure of graphene (2D), and graphitic domains (3D), gives outstanding electrical and thermal conductivities, mechanical strength or porosity as described in Table 1. Approaching these properties is crucial for biocarbon to suit specific applications listed above.
| Property | Observation scale | Analysis method | Graphite characteristics | Reference |
|---|---|---|---|---|
| Structure | Macroscopic | X-Ray diffraction | 00 l peak at 2θ(CuKα) ∼ 26.5° (basal plane reflection) and peaks with hk0 indices (diffraction of crystal planes perpendicular to basal planes) | [6] |
| Microscopic | Raman Spectroscopy | Small D band around 1350 cm−1 of defects in sp2 carbons and sharp G band around 1580 cm−1 of sp2 carbons | [15], [26] | |
| Nanoscopic | X-ray total scattering – Pair Distribution Function analysis | Lattice parameter a = 2.461 Å (in-planeinteratomic distances). Interplanar spacing 1/2c = 3.354 Å | [16] | |
| Texture | Nanoscopic | High Resolution Transmission Electron Microscope (HRTEM) | Stacked graphene layers | |
| Surface functionality and purity | Nanoscopic | X-Ray Photoelectron Spectroscopy | sp2 hybridized carbon at 284 eV (C 1 s spectra) | [31] |
| Chemical structure | Nanoscopic | Nuclear Magnetic Resonance | Peak linked to aromatic ring and C = C bond between 110 and 160 ppm | [32] |
| Electrical conductivity | Macroscopic | Steady-state method, four probes method |
Natural graphite 90.00 – 1130.00 S.cm—1. Graphite powder 11.60 – 508.00 S.cm—1 Graphene 13,000.00 S.cm—1 |
[33] |
| Thermal conductivity | Macroscopic | Steady-state or transient method | Graphite around 100 Wm-1K−1 and theoretical graphene > 2,000 W.m-1K−1 | [34], [35] |
| Porosity | Microscopic | Gas adsorption | Specific surface area of theoretical graphene > 2500 m2.g−1 | [36] |
| Mechanical strength | Nanoscopic | Nanoindentation | Young modulus of bulk graphite 1.0 TPa. Breaking strength of graphene 42 N.m−1. | [37] |
Producing graphitic materials from lignocellulosic biomass is challenging since it is non-graphitizable. These materials could not achieve a graphitic order, even at high temperature (above 3000 °C). This paper gives an overview on three thermochemical processes selected for their impact on biocarbon graphenization production and mechanism.
During the thermal treatment of biomass, the feedstock will undergo various transformations including carbonization, graphenization and graphitization [5]within specific temperature ranges. Carbonization is the transformation from organic material to carbon rich solid (containing carbonaceous solid with sp2carbon hybridization). Two steps in carbonization can be distinguished based on soft carbon studies [6]. First, primary carbonization occurs at low temperature up to 550 °C, where stable polymer units called Basic Structural Units (BSU) are formed [7]. BSU are small units composed of about three stacked graphene layers (about 1 nm diameter). They are highly aromatic and can be formed from either solid (mostly the case of hard carbon) or liquid phase carbonization (case of soft carbon). The BSUs with similar orientation are arranged in Local Molecular Oriented domains (LMO). Up to 2000 °C, the material goes through secondary carbonization. This allows the formation of graphenic domains by BSU stacking and then junction into the LMO domains. The structuration of those domains is highly dependent on temperature, residence time and porosity. At higher temperature, above 2000 °C, structural changes will distinguish graphenization from graphitization. Graphitization refers to the formation of a graphite structure, defined by the 3D orientation of stacked graphene layers resulting in a long crystalline order [5]. Graphenization on the other hand, is the apparition of graphene layers with moderate length and poor stacking, through the rearrangement of graphitic domains and volatilization of amorphous material.
Our interest in this review is focused on graphenization, meaning the formation, stacking and early stages of graphene layer growth in the biocarbon. It is worthy to note that graphenization assessment requires various analytical techniques for which spectra treatments are requested. Therefore, values will be compared within rather between studies.
The growth stages are tunable and highly dependent on the process, conditions (catalyst, pre-treatment, temperature, heating rate) and feedstock. Since the composition of lignocellulosic biomass can also affect graphenization, its three macropolymers (cellulose, hemicellulose and lignin) can be studied separately to understand their individual influence and behavior during graphenization. This review proposes a thorough analysis of the parameters influencing the graphenization in three processes: conventional catalytic pyrolysis, hydrothermal carbonization and solar pyrolysis. Those processes are also selected for their environmental impact, which energy demand is assessed in the last section.
2. Conventional graphenization
Pyrolysis is a thermochemical process that decomposes organic matter in an oxygen-free atmosphere. Biomass pyrolysis is performed at moderate temperature and leads to three phases: gases, liquid tars and solid residue. The fraction of solid residue ranges from 5 % to 30 % of initial solid. Carbon content in the solid residue can reach up to 80 wt% (ash free) leading to a carbonaceous material called biocarbon [8], [9]. The product obtained can range from unorganized to turbostratic carbonaceous material including well-structured graphenic domains. Depending on the targeted carbon organization, the production temperature could go beyond 2000 °C. To optimize the quality and quantity of graphenic domains obtained in the process and increase energy efficiency, a catalyst is required. The combination of various catalysts and feedstocks lead to several mechanisms and a wide range of structured biocarbons [10]. Since catalytic graphenization of petro-resources is largely described in the literature [11], [12], this section will focus on catalytic graphenization mechanisms of biomass and biomass polymers.
2.1. Catalytic graphenization from biomass
Lignocellulosic biomass refers to agricultural or industrial wastes, forest or herbaceous resources. This bioresource is abundant, worldwide spread, cheap, non-edible and renewable. However, its non-graphitizable character and low carbon content (mostly sp3 hybridized) make its conversion into graphitic material challenging. In a conventional biomass pyrolysis, without catalyst or pretreatment, the biocarbon will mostly contain turbostratic domains [13], even beyond 2000 °C. Transition metals are efficiently catalyzing graphitization. Iron, Cobalt and Nickel are found in various studies to produce for example porous graphite from bamboo [14], or partially graphitized biocarbon from medium-density fiberboard (MDF) [13], [15], [16], beech wood [15], [17], or pine sawdust [18]. In these works, transition metals demonstrated a catalytic effect on biocarbon below 2000 °C. Nickel promoted the formation of graphite-like phases in MDF and beech wood biocarbons above 1400 °C. A turbostratic shell of graphene layers grew around Ni particles [13], [15].
The graphitization degree assesses the proportion of graphitic carbons from turbostratic (g = 0) to perfect graphite (g = 1). It is calculated with Equation (1), using the interlayer distance (
Equation (1): Graphitization degree
The graphitization degree of biocarbon from bamboo increased with temperature from 550 °C to 1300 °C using a catalyst [14]. At 850 °C,
Iron is preferred to cobalt or nickel, since it is nontoxic and abundant. Basically, the graphitization mechanism using transition metals follows the dissolution of amorphous carbon, carbide formation, and precipitation of graphitic carbon at the carbide surface (see Fig. 1) [18], [20].

Fig. 1. Catalytic graphenization mechanism of carbonaceous material using metal catalyst. a) carbon dissolution in the metal particle. b) Carbide in an empty space. c) Precipitation of graphene layer. d) Separation of graphene layers from metal particles. .
Reproduced from [20]Bimetallic catalysts also improve graphenization at much lower temperatures. Indeed, similar graphitization degree of bamboo biocarbons were obtained at 1300 °C using Fe-Co catalyst and at 2500 °C without catalyst [14]. It is also higher with bimetallic Fe-Co catalyst (0.432) than single (Fe 0.165 and Co 0.383). The Fe-Co alloy exhibits the best catalytic effect out of the different catalysts (Fe, Co, Ni) and their combinations (Fe-Co and Fe-Ni) thanks to a synergetic effect of the transition metals. Other bimetallic catalysts are efficient for biomass graphenization such as CuNi [21] or NiMo [22]. Combination of metallic catalysts also improve properties simultaneously. For example porous graphenic material with large specific surface area (1874 m2.g−1) and good conductivity were produced for supercapacitor electrode [23]. This was achieved at 900 °C from coconut shell by combining a graphenization catalyst (FeCl3) and a porosity activating agent (ZnCl2).
Other elements than transition metals also act as graphenization catalysts. For example, the self-catalyzing ability of a calcium-rich biomass such as camphor leaves was evidenced in high resolution transmission emission microscopy (HRTEM) through the graphene layers formation around CaO particles [24]. First, CaCO3 crystalline particles were formed at 600 °C, latter decomposed into CaO at 900 °C acting then as graphenization catalyst.
Quality and quantity of graphenic or graphitic domains in a biocarbon can be assessed by comparing biocarbon structure at different scales to graphite as listed in Table 1.
At macroscopic scale, information such as thickness and length of graphene layer, interlayer spacing and stacking can be extracted from XRD. Diffractograms of natural graphite particularly present a sharp peak at 2θ(CuKα) around 26° arising from hexagonal graphite crystallite’s basal reflection (0 0 2). Its position serves interplanar spacing d002 calculations [6]. d002 equals 3.354 Å for perfect graphite and 3.44 Å for turbostratic material [25]. Qualitative and quantitative information on the biocarbon graphenization are obtained from width and position of (00 l) and (hk0) peaks giving stacking (Lc) and average diameter of basal plane (La) (Scherrer equation) [26].
Raman spectra analysis informs on microscopic structure, since D band (1320 – 1365 cm−1) and G band (1520 – 1600 cm−1) are characteristic of biocarbons. More precisely, the (ID/IG) ratio calculated using the intensity of related Raman peaks [15], [27] is low for ordered carbons. This ratio is also denoted as (ID1/IG) in poorly ordered carbons when the D1 peak is extracted from signal curve-fitting to eliminate amorphous contribution (the valley between the 2 bands) [26]. Basically, (ID1/IG) ratio decreases with temperature or catalyst activity, meaning a high proportion of graphitic structures in the biocarbon [14]. For example, the ID1/IG ratio of bamboo biocarbons produced at the same temperature decreased from 4.08 (without catalyst) to 1.97 with iron and 1.78 with iron/cobalt [14].
XRD and Raman methods are usually complementary, as illustrated in Fig. 2. Phoenix tree leaves mixed with K2FeO4 were calcinated at 650 °C, 800 °C and 950 °C. The XRD (Fig. 2.a) shows the increase in graphitic content through the formation and sharpening of graphite (0 0 2) peak with temperature. This was further confirmed through the decrease of (ID1/IG) ratio from 650 to 950 °C, by Raman analysis (Fig. 2.b).

Fig. 2. XRD (a) and Raman spectrum (b) of biocarbons from phoenix tree leaves treated with K2FeO4. From amorphous microporous biocarbon at 650 °C to semi-graphitized microporous at 800 °C and graphitized mesoporous carbons at 950 °C. .
Adapted from [28]Structure information at nanoscopic scale (scale factor, lattice parameters, spherical crystallite size) is given by pair distribution function (PDF) analysis on X-ray total scattering. This technique is particularly relevant for materials like biocarbon with local ordering and low crystallinity [29], [30]. The effect of production temperature on Medium Density Fiberboard (MDF) with iron catalyst at nanoscale is explained by Gomez-Martin et al [16]. They used lattice parameter and interplanar spacing to reveal the curvature of graphene layers under 1200 °C that progressively unfold to reach a planar stacking at 1400 °C, close to ideal graphite parameter. Basically without catalyst, graphenic domains coalesce at about 1400 °C and unfold 2000 °C to form graphite [7]. Therefore, this study is of great interest showing that unfolding occurred at 1400 °C with iron catalyst, gaining at least 600 °C.
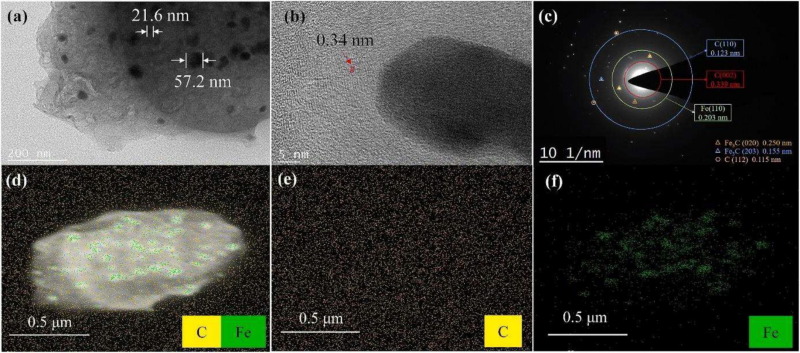
Other important properties are texture (graphenic sheet orientation) and nanotexture (stacking quality) of graphene layers which are obtained by Transmission Electron Microscopy (TEM) The graphene precipitation around the iron carbide was evidenced by Sun et al [18], and the interlayer distance was estimated as seen on Fig. 3 [18]. In addition to previous characterization techniques, position and chemical identification of the present atoms is done using Selected Area Diffraction (SAED) and Energy-Dispersive X-ray Spectroscopy (EDS).

Fig. 3. Surface morphology of pine sawdust with iron catalyst treated at 800 °C. TEM x41,000 (a); TEM x1,360,000 (b); SAED (c); EDS elemental mapping (d); C (e); Fe (f). .
Reproduced from [18]At nanoscopic scale, properties such as surface functionalities and purity of graphene layers help to estimate the graphenization quality. X-Ray Photoelectron Spectroscopy (XPS) identifies elements and their bonds at the extreme surface. In the case of biocarbons with a low graphitization degree, the change in aromaticity is better suited to inform on the resource’s structuration. In Gai et al [31] the high resolution C 1 s and Fe 2p spectra show an increase of sp2/sp3 carbon ratio with increased temperature and the conversion of Fe catalyst into Fe2O3 functional groups. Nuclear magnetic resonance (NMR) spectroscopy also gives insights on the chemical structure and atomic bonds in the biocarbon. Solid-state 13C NMR spectroscopy applied to various biomass and biowastes was used to evaluate the biocarbon chemistry [38]. Increasing the pyrolysis temperature from 350 °C to 600 °C, NMR spectra showed both the influence of feedstock and temperature on the aromaticity itself, as well as the size and purity of the aromatic ring structures. McBeath et al [38] analyzed the aromatic peak at 130 ppm which relative intensity increases with increasing temperature and the spinning sidebands associated. The elimination of methoxyl groups and other C = O bonds with temperature is also observed, indicating the elimination of graphene sheets defects [39].
Graphenic materials are mostly desired for their high electrical and thermal conductivities, which also give insights on catalytic graphenization. The thermal conductivity can be measured using a steady-state method where a continuous temperature gradient is applied to the sample in vacuum [34]. The thermal conductivity (measured at 27 °C) of biocarbon produced at 1500 °C from MDF with nickel catalyst was 2.3 times higher than the one produced without catalyst at the same temperature [13] This change in thermal conductivity highlights the formation of a bulk graphite phase inside an amorphous matrix. This method can also give electrical conductivity (σ) from resistivity (ρ) measurements using the relation σ = 1/ρ [13]. The electrical conductivity is 1.3 to 2.0 times higher in biocarbon obtained with Ni-catalyst than without. The obtained electrical resistivities and thermal conductivities are listed in Table 2. The capacitance of biocarbon used as electrode material also highlights the impact of its high graphenic content [23].
Table 2. Thermal conductivity
| Sample |
|
ρ0, Ω cm (300 K) |
|---|---|---|
| MDF-C-850 | 2.43 | 0.158 |
| MDF-C-850(Ni) | 3.84 | 0.1317 |
| MDF-C-1500 | 4.45 | 0.017 |
| MDF-C-1500(Ni) | 10.35 | 0.0106 |
| PI-C-2400 | 12.65 | 0.007 |
| BE-C-2400 | 9.65 | 0.0065 |
Reproduced from [13]
The electrical and thermal conductivities of biocarbon are highly linked to the material’s porosity [40]. Porosity can be modified by chemical activation (pore development) [6], using KOH, H3PO4, NaOH or ZnCl2 [28], [41], [42], [43]. Various techniques can inform on porosity depending on the pore sizes but gas adsorption methods are commonly used to investigate nano to meso-pores. For example, the combination of potassium as activating agent and iron catalyst for pyrolysis of phoenix tree leaves, produced micro-porous carbons with high conductivity (2.38 S cm—1) [28] thanks, in part, to the large specific surface area of 2208 m2g−1 comparable to theoretical graphene specific surface area of more than 2500 m2g−1 [36].
Catalytic graphenization of biomass was successfully carried out at temperatures significantly below 2000 °C. Transition metals, and especially iron, are the most efficient catalyst. however, biomass is a complex material and better understanding of the catalytic effect its components is required.
2.2. Catalytic graphenization of biomass polymers
The study of lignocellulosic biomass components helps differentiating their behavior. Cellulose is a semi-crystalline carbohydrate composed of linear chains of D-glucose with a high degree of polymerization and it decomposes between 300 and 500 °C. Lignin decomposed in a larger range (200–800 °C), due to its highly reticulated structure. Hemicellulose on the contrary is weakly polymerized, mostly amorphous and is completely decomposed at 350 °C which limits the graphenic biocarbon yields.
2.2.1. Cellulose
Cellulose, present in large proportion in biomass, is easily extracted and its chemical structure is independent from biomass type or extraction process. However, this polymer contains only carbon with sp3 hybridization, making it difficult to graphenize. In spite, the use of a catalyst for cellulose graphenization was successful.
Mechanism of iron-catalyst graphenization on cellulose fibers was stated as follows: Fe(NO3)3 catalyst decomposes into FeOx nanoparticles that react with cellulosic carbon to form Fe3C [44]. The crucial step in the graphenization mechanism is iron carbide (Fe3C) nanoparticles formation. Indeed graphenic materials will grow around the iron carbide from carbon precipitation, and the size of iron carbide particle has a strong impact on the stacking [45]Erreur! Source du renvoi introuvable.. These authors dispersed Fe(NO3)3 in cellulose matrix and performed pyrolysis at 1000 °C and 1800 °C. Magnetic measurements together with XPS and XRD analyses revealed that large iron particles of 31 nm obtained at 1800 °C with a low oxidation degree of iron offered an ideal environment for graphitic carbon precipitation around the catalyst particle. The nanostructure of these iron-catalyzed biocarbons at 1800 °C is 70 wt% of nanocrystalline carbon and 30 wt% of crystalline rhombohedral graphite [29]. At 1000 °C, non-impregnated biocarbon is mostly amorphous while iron-impregnation produces a nanocrystalline phase. Therefore, iron has a catalytic effect on short-range stacked layers and highly crystalline graphenic domains.
Catalytic graphenization of cellulose was also achieved using calcium [46]. Cellulose impregnated with increasing concentration of calcium showed an improvement toward few graphene layers material after pyrolysis at 1800 °C [46]. As for the transition metals, calcium reacts with carbon to form a carbide at about 1300 °C [47]. The interlayer distance is reduced from 3.70 Å in non-impregnated cellulose to 3.48 Å in cellulose with 3.14 wt% of calcium as evidenced in XRD and HRTEM. This catalyst is abundant, cheap, nontoxic and inherently present in lignocellulosic biomass, making it a good candidate for this purpose.
Although cellulose does not contain unsaturated carbons, its graphitization was improved below 2000 °C by using catalysts such as transition metals, or calcium. Mechanisms are mostly involving carbide formation and its further decomposition into graphenic shell around the catalyst. the next section will detail mechanism involved for another biomass component.
2.2.2. Lignin
Another biomass polymer of interest is lignin. Present in biomass in lesser proportions than cellulose, it already contains aromatic carbon rings. However, its composition and structure can be altered during the extraction process and is dependent on the biomass type.
As for the other feedstocks, transition metals are largely used for lignin catalytic graphenization. Their catalytic power at 1100 °C is ranked as Fe > Co > Ni > Zn [48]. Catalytic graphenization of lignin was achieved at 900 °C using Fe(NO3)3as catalyst and tetrahydrofuran as activating agent for biocarbon electrode [49]. The resulting electrical conductivity confirmed that this graphenic biocarbon could be suitable for electrochemical energy storage application. As explained earlier, porosity can influence the electrical properties of biocarbon, and porosity is tuned with an activating agent such as tetrahydrofuran [49] or with pretreatment. Graphenic biocarbon were produced from either oven- or freeze-dried iron/ lignin mixtures prior to carbonization at 1200 °C [50]. The drying technique did not influence the texture but modified the porosity. Fe-supported lignin from freeze-drying prevented lamination of graphene during solid-state carbonization. This is explained by the sparsity of the precursor in the fluffy freeze-dried powder. This study shows that final porosity does not significantly modify the quality of the carbon sheets at this temperature, but it can be of prime interest for specific applications.
The chemical structure of lignin depends on its origin and extraction process. Therefore, mechanisms or graphenization efficiency may differ when comparing the literature data.. A commercially available kraft lignin contains sulfur from the extraction process which acts as a graphenization agent during calcium-catalyzed graphenization [51]. Calcium oxide reacted with carbon to form a calcium carbide that precipitated into graphenic material around the catalyst particle as illustrated in Fig. 4. The calcium released after this reaction also reacts with sulfur in the case of kraft lignin. This calcium sulfide may prevent the total encapsulation of calcium carbide exposing more amorphous carbon to form graphenic layers. Unlike transition metals, calcium catalyst is partially removed from the biocarbon beyond 1400 °C, reducing ash content and biocarbon impurities.

Fig. 4. Mechanisms controlling calcium-catalyzed graphenization of cellulose-derived biocarbon. .
Reproduced from [51]Various routes to produce graphenic biocarbon using catalytic graphitization are listed in Table 3. Defining a universal and measurable degree of graphitization is difficult to compare all the strategies. However, structural and textural changes in biocarbon are determined using different characterization techniques that estimate the quality and quantity of graphenic domains.
| Resource | Catalyst | Atmosphere | Temperature(°C) | Residence time (min) | Reference | |
|---|---|---|---|---|---|---|
| Petro resource | Petroleum cokes | S | Ar | 1400–2750 | 30–600 | [11] |
| Monolithic glasslike carbon | Cu, Ag, Mg, Zn, Cd, B, Al, Zr, Si, Ge, Sn, Pb, Nb, Sb, Bi, Cr, Mo, Se, Te, Fe, Co, Ni, Pd, Pt | Ar | 315–2720 | 5 | [12] | |
| Biomass | Medium-density fiberboard | Ni | N2 | 850, 1500 | 30 | [13] |
| Medium-density fiberboard | Fe | N2 | 850–1600 | 30 | [16] | |
| Medium-density fiberboard, beech wood | Ni | N2 | 600–1600 | 30 | [15] | |
| Beech wood | Ni | N2 | 850–1600 | 30 | [17] | |
| Red oak, beech wood | Ni | N2 | 600–1600 | 360 | [40] | |
| Camphor leaves | Ca | N2 | 700–1000 | 60 | [24] | |
| Phoenix tree leaves | Fe | Ar | 650–950 | 120 | [28] | |
| Pine sawdust | Fe | N2 | 600–800 | − | [18] | |
| Coconut shell | Fe, Zn | N2 | 900 | 60 | [23] | |
| Bamboo | Fe, Co, Ni, FeCo, FeNi | N2 | 550–1300 | 60 | [14] | |
| Powdered mandarin peel | CuNi | N2 | 300–700 | 15 | [21] | |
| Sawdust | NiMo | N2 | 750 | 120 | [22] | |
| Biomass polymer | Sugarcane bagasse, microcrystalline cellulose | Fe | Vacuum | 1000 | 60 | [31] |
| Microcrystalline cellulose | Fe | N2 | 1000–1800 | 60 | [29] | |
| Empty fruit bunch | Fe, Zn | N2 | 900 | 90 | [42] | |
| Glucose, starch, cellulose fibers | Fe | N2 | 800 | 60 | [44] | |
| Microcrystalline cellulose | Fe | N2 | 1000–1800 | 60 | [45] | |
| Microcrystalline cellulose | Ca | N2 | 1800 | 60 | [46] | |
| Bamboo ethanosolv lignin | Ni, Fe, Zn, Co | Inert atm | 1100 | 240 | [48] | |
| Lignin | Fe | N2 | 900 | 180 | [49] | |
| Alkaline lignin | Fe | Inert atm | 1200 | 60 | [50] | |
| Microcrystalline cellulose, krat lignin | Ca | N2 | 1000–1800 | 60 | [51] |
Catalytic graphenization follows the main mechanism of formation and precipitation of a carbide. It is also outlined that the conditions of preparation can affect the resulted biocarbon properties. A better understanding of catalytic mechanisms and importance of carbonization phases enables the optimization of pyrolytic processes. The limitation of such technique resides in the solid-state carbonization that the biomass undergoes which does not favor graphenization at low temperature. Therefore, pre-treatment would be an interesting option to improve graphenization ability.
3. Carbon structuration in hydrothermal carbonization
From initial state of carbon material to graphenic carbons, primary carbonization is the first step that govern the graphenization ability. The graphenization could be improved with a catalyst during the first and secondary carbonization, as seen in section 1, or using pre-treatment methods.
A low temperature treatment (under 550 °C) could enhance the graphenization of biocarbon through a liquid phase primary carbonization. This can be facilitated by hydrothermal carbonization (HTC), which converts biomass to carbon rich material with reactor filled with water under subcritical conditions. The resulting solid is called hydro-biocarbon (in contrast to biocarbon referring to pyrolysis solid yield).
The aim of some HTC studies is the direct use of hydro-biocarbon thanks to a controlled porosity using activating agents and/or catalysts [52], [53]. Hydro-biocarbons are materials ranging from amorphous to turbostratic carbons, for which structuration is hardly quantifiable at a global scale but could be evaluated through chemical functionalities quantification at nanoscopic scale [54]. Thus, HTC is mainly used as a pre-treatment prior pyrolysis to produce activated carbons for gas sorption or hydrogen storage with controlled porosities [55]. Since the porosity and biocarbon structuration are interrelated [56] this would be helpful for a better understanding of pre-treatment effect on graphenization.
3.1. HTC pre-treatment in biomass graphenization
Carbon-rich materials are obtained from hydrothermal carbonization of various bioresources, and their chemistry is highly affected by the process conditions. A factor combining temperature and residence time, the severity factor [57], has been proposed by Ruyter [58] from Arrhenius law and the calorific value and later improved by Overend et Chornet [59].
The severity factor (Equation (2) is useful to compare the experiments at various operating conditions. It is expressed as a function of time (t in minutes) and temperature (T in °C).(2)
Equation (2): Severity factor
Hydrothermal treatment with high severity factor enhances the hydro-biocarbon aromatization [57], [60], [61]. Since aromatization degree is low in hydro-biocarbons, an additional thermal treatment (secondary carbonization) is required to form highly graphenized structures.
The complex mechanism of carbonization and then graphenization has been described in different theories and models [7], [56], [62], [63], [64]. The primary domains (1 nm long and 3 stacked sheets) called Basic Structural Units (BSU) [7]are surrounded by a liquid or solid media, depending on the way of primary carbonization [64]. During secondary carbonization, crystallites are formed from the BSU stacking and coalesce into Local Molecular Oriented (LMO) domains. The final nanotexture is directly determined by the pores size between the LMO [65]. Mesoporosity favored the graphitization, while non-graphitizable carbons were microporous. Indeed, the angle between LMOs around a pore approaches planarity as the pore size increases. Based on these theories, carbonization in liquid media is a way of promoting the development of BSU and LMO in mesoporous biocarbons for further graphenization.
The presence of mesopores (around 10 nm) in some hydro-biocarbons could help selecting suitable feedstock for graphenization [56]. The pores size was tuned using ZnCl2 as activation agent during HTC of sawdust and coconut shell powder [66]. Mesopores and some micropores were observed through scanning electron microscopy and the specific surface area increased from less than 10 m2.g−1 to 200 m2.g−1 at 220 °C. These materials are suitable for water remediation [67] or as precursors of graphenization.
The evaluation of pre-structuration efficiency requires a structural analysis at atomic scale. Aromaticity of wood hydro-biocarbon was quantified using 13C direct polarization/magic angle spinning solid-state (DP/MAS) NMR techniques [68]. The aromatic carbon rate and the ring condensation index showed an aromaticity increase with the severity. Since HTC pre-treatment removes oxygen from biomass and enhance aromatization, the resulting aromatic clusters (BSU) are suitable precursors of graphitization.
The combination of hydrothermal carbonization followed by pyrolysis was applied to coconut coir dust to produce curved graphite structures and compared to a single pyrolysis step [69]. The nanotexture (graphene layer length, stacking and flattening) was improved with the two-step graphenization (HTC-pyrolysis) as highlighted in Fig. 5Erreur! Source du renvoi introuvable.. The interlayer distance approached that of graphite (d002 = 3.354 Å) while it increased to about 3.4 Å for pyrolysis biocarbon. Raman spectroscopy also indicated a significant decrease of the amorphous content since the ratio of valley to G band intensities equaled to 0.19 and 0.59 for the two-step and pyrolysis process respectively. The final curved graphite structures are therefore formed from the junction of large (secondary char microspheres) produced during hydrothermal carbonization and otherwise absent for pyrolysis.

Fig. 5. Raman spectra (left) and XRD patterns (right) of the sample after two-step synthesis (a) and one-step pyrolysis (b). In XRD, * = quartz substrate and * (red) = graphite peaks. . (For interpretation of the references to colour in this figure legend, the reader is referred to the web version of this article.)
Reproduced from [69]Similarly, combined HTC and thermal treatment at 800 °C of chitosan resulted in the improvement on graphenic sheets length (La of about 45 nm) [70]. Those examples illustrate the gain of carbon pre-structuration through HTC, which generates an ideal precursor of mesophase type and further organized during pyrolysis.
3.2. HTC pre-treatment in biomass polymers graphenization
Hemicellulose, cellulose and lignin produce various graphenization precursors composed of primary and secondary chars. Their production and quantity highly depend on the operating conditions and the nature of feedstock [71], [72], [73]. Primary char is generated from chemical transformations in solid state, during which the resource kept its original morphology, but its chemistry evolved. Secondary char comes from the dissolution of organics into the liquid phase and their subsequent precipitation as microsphere by Gibbs energy minimization [74]. Secondary char is particularly interesting for graphenization since it enhances BSU development and further LMO size.
Organics go through a sequence of reactions from hydrolysis, dehydration polymerization, aromatization to nucleation[62], [75], [76], [77] as we proposed in Fig. 6.
 Fig. 6
To summarize, cellulose and hemicelluloses hydrolysis produces sugar-like soluble products which form furfurals and aldehydes after dehydration [78]. Furfural forms a furanic hydro-biocarbon through decarboxylation reaction. By increasing severity (temperature, time), furans evolve to aromatic structures and then polyaromatic hydro-biocarbons via a series of reactions including ring-opening, aldol-condensation and Diels-Alder. Hydrolysis of furfural forms phenolic fragments that polymerize with small aldehydes to form phenolic hydro-biocarbon. Lignin, which already contains aromatics groups, is mainly degraded by cleavage of weak C–C bonds (β-O-4 and 5–5 linkage) [52], forming soluble guaiacol and guaiacylglycerol fragments. The first fragment produces phenols while the second generates furans and aldehydes. Although the hydro-biocarbon can exhibit all characteristics, phenols and aldehydes quickly polymerize into phenolic secondary char. Kinetics studies of lignin in sub and supercritical water supported the high reactivity of depolymerization and repolymerization reactions, even at short reaction time [79], [80] In addition, similar functions were obtained in hydro-biocarbons from three types of lignin (dealkaline, alkaline and kraft lignin) [81]. Polyaromatic and phenolic hydro-biocarbons increased the final aromaticity.
Aromaticity assessment is facilitated with XPS analysis, as described previously. Short graphene sheets were produced from lignin using the combination of HTC at 240 °C and pyrolysis at (800–1200 °C). Aromaticity (sp2/sp3 ratio) significantly increased from 2.75 for the original lignin to 4.22 for the biocarbon produced from HTC and pyrolysis at 800 °C. The increase of sp2 carbon content evidenced its aromatization [82].
Hydrothermal carbonization is a versatile process used for oil, gas and char production. The focus has been put on its role in graphenization combined processes to go from a typical non-graphitizable carbon (lignocellulosic biomass) to a graphitizable one. During HTC, the crucial formation of BSU and their association in LMO domains is the pivotal step lacking in direct pyrolysis of non-graphitizable resources. This pre-treatment is interesting for the direct use of wet biomass and for energy cost reduction for graphitization purposes [69]. The issue of energy cost could also be resolved with an alternative energy source for thermal treatment.
4. Concentrated solar to leverage graphenization
Graphenic material obtained from lignocellulosic biomass thermoconversion is a more sustainable way than using petro-resource (coke, coal). However, the CO2emissions associated with electrical thermochemical processes depend on the energy mix and operating conditions. So far, energy saving has been mainly investigated through decreasing temperature of electrically heated processes. Another solution could be the use of an alternative energy source such as concentrated solar energy.
Solar pyrolysis heats, at high rate, a material placed at its focal point. Solar concentration devices are thus used to pyrolyze biomass replacing conventional electric furnaces. Solar pyrolysis enables to operate a wide range of temperatures going from a few hundreds to a couple thousands of Celsius degrees depending on the concentrating system. Thanks to its high flux density, fast and flash pyrolysis can be performed. Slow conventional pyrolysis favors the production of solid and oily phase whereas fast and flash pyrolysis favors gas production, lowering oily [83] and solid phases [84]. Consequently, solar reactors have been firstly used for gasification [85], [86]. However, the interest grew on other pyrolysis by-products valorization, such as bio-oil for biofuel production, biocarbon for soil amendment or energy storage [87], [88], [89].
4.1. Solar pyrolysis of biomass
Graphenization of solid biocarbon is less studied in the field of solar pyrolysis due to low solid yields obtained at high heating rates. Regardless, some authors used concentrated solar and estimated the graphenization degree of solar biocarbon.
Turbostratic solar-induced biocarbon were obtained from various fruit peels [90]. Treatment is carried out using a biconvex lens, although parabolic or trough-type solar concentrators are generally preferred for biomass conversion. After a couple of seconds exposure at more than 1000 °C, a higher carbon structuration (sp2 hybridized carbon) was observed in the exposed region, as confirmed through high-resolution C 1 s XPS spectra. Nevertheless, graphenic domains did not reach a highly crystalline structure at these operating conditions as seen on XRD results. For example, banana peel biocarbons reached an interlayer spacing of 3.81 Å, far from the perfect graphite (3.354 Å).
Slow solar pyrolysis on agave bagasse fibers was studied at various temperature and heating rate [91]. By increasing the temperature from 500 °C to 900 °C, the 002 and 100 peaks from X-ray diffractograms became narrower and more defined indicating an evolution to a more crystalline material as seen on Fig. 7. The heating rate was also studied at 500 °C, and the biocarbon was more amorphous at a heating rate of 30 °C/min than 4 °C/min as shown by Raman spectra and X-ray diffractograms. This result emphasizes the importance of heating time in sp3 to sp2 carbon hybridization. Ayala-Cortés et al [91] also highlighted the presence of calcite and calcium oxides which can act as graphenization catalyst [24].

Fig. 7. XRD diffractograms of washed biocarbons produced at different temperatures and heating rates. Calcium carbonate and hydroxide were detected before washing. .
Adapted from [91]Similar conclusions are reported for tomato plant and agave leaves solar pyrolysis [92]. The graphenization quality was mainly evaluated through XRD and Raman analyses. With agave leaves, nanocrystalline graphitic domains appear progressively beyond 1000 °C, and the ID/IG ratio decreases from 1.71 at 1100 °C to 1.10 at 1560 °C. Since tomato-plant feedstock contained 36 wt% of ash, biocarbon production was limited to 900 °C. At similar temperatures, these biocarbons were significantly less organized than that from agave leaves. It is due to alkaline metals promoting microporosity which is detrimental to graphenization. These biocarbons are more dedicated to electrical storage applications [92].
The use of metal catalysts for biocarbon graphenization can also be extended to solar pyrolysis. Heavy metal (Cu and Ni) contaminated willow wood solar pyrolysis was studied at different temperatures and heating rates [93]. Biocarbons organization increased with temperature and catalyst [94]. At 1600 °C for example, the ID1/IG ratio (Raman spectra) of willow biocarbons decreased from 3 to 2 by adding Ni catalyst. Cu impacted the ratio of sp3/sp2carbons to a lesser extent.
The general conclusions for solar and conventional biocarbons are similar. Graphenization degree and structuration of carbonaceous products increased with temperature, as expected. A slow (solar) pyrolysis of few degrees per minute improved the crystallinity whereas a faster heating rate of tens degrees per minute promoted microporous biocarbons [91], [95].
Solar pyrolysis provides high radiative flux focused on a small area, which is a key factor to turn carbons from carbonization to graphenization. In other words, this flux density improves BSUs coalescence and graphene layer flattening (from turbostratic to graphitic) which usually requires temperatures above 1600 °C.
Similar graphenization mechanisms could be expected for conventional and slow solar pyrolysis [91]. However, high heating rate (fast and flash pyrolysis) would affect mechanisms of biocarbon structuration. Solar flash pyrolysis of willow-wood board with directional xenon irradiation up to 20 s showed a two-steps mechanism of biocarbon formation with primary reactions and intra-particle secondary reactions [96]. The second stage was mainly affected by the wood pellet size rather than the intensity of the radiative flux. The secondary reactions consisting of the decomposition of the primary char, deoxygenation and condensation of heavy compounds lead to the formation of aromatic compounds. The biocarbon structure was further investigated along the pellet thickness [97]. The pellets being irradiated from one side, they defined four different layers from the surface to the core pellet (Fig. 8). Graphitization was highlighted at the biocarbon surface, which was exposed to high density energy for the longest time. The next layer (biochar or inner layer) mainly contained biocarbon with high aromatization degree suitable for further graphenization. Behind the biocarbon layer, the intermediate layer was described as a molten phase, which enhanced the secondary reactions. These secondary reactions in the wood are due to the short lifetime of the intermediate liquid species as explained by Lédé et al [98] in their layer model of cellulose pellets. These intermediate liquid compounds formed gases, condensable vapors and biochar [99]. Finally, these layer models fitted with an increase of aromatization degree from the core to the shell.(See Fig. 9).

Fig. 8. Physicochemical structure evolution mechanism of biocarbon during solar pyrolysis. .
Adapted from [97] Fig. 9
Fig. 8 shows the different stages of the mechanism. The wood was first pyrolyzed and transformed into an intermediate molten phase that continuously produced biocarbon. Condensation of the liquid products improved the number of aromatic rings and oxygen-containing functional groups. By increasing time, aromatic rings fused, and surface functional groups were removed. This gave different graphenization degrees in the pellet depending on reaction time and depth position. Graphenization degree increased with the direct solar radiation, thus close to the surface with sufficient contact time. This heterogeneous biocarbon profile in the initial pellet was successfully modelled for beech wood pellets [100] for beech wood pellets. In line with experimental results, the CFD model applied to simulate fast solar pyrolysis showed that the heating rate decreases as the focal point moved inside the pellet. The heating rate inside the biomass plays an important role on the products yields and biocarbon chemistry, hence the different stages of biocarbon structuration.
Although solar pyrolysis was not specifically used for biocarbon production, the graphenization was improved thanks to the high energy density at the focal point, increasing ring coalescence of aromatics below 1600 °C. However, production at large scale is challenging.
4.2. Challenges of solar pyrolysis for biocarbon production
Limitations of solar pyrolysis for biomass conversion are mainly the production of fumes that can depose on the reactor window, the temperature gradient due to surface heating of the feedstock by the concentrated solar beam and upscaling challenges. Advantages are linked to the capacity of the solar concentrating systems to achieve heating rates and plateau temperatures in large domains[95], the inherent clean energy nature of the power source and the versatility of reaction atmosphere.
Solar processes upscaling issues have been pointed by Rahman et al [101]. Up to now, most of the reactors were not designed for high quantity of solid production and can usually hold between a hundred milligrams [102] to ten or twenty grams [91], [92]. The key issue is the size of the focal zone and the highest temperature desired. Larger reactor capacity of 15 kg reached only moderate temperatures (320 °C) [103]. Nevertheless, this issue can be overcome by a precise design of the concentrating system [104]. Various solar reactor technologies were detailed in several articles [105], [106]. Regarding incident flux modification due to aerosol (fumes) deposition on the transparent window can be solved by smart injection of sweeping gas.
To take advantage of different processing modes, concentrated solar energy was used for example to heat HTC reactor [107].
The use of solar concentration instead of electrical heating ensure a gain in energy and thereby an environmental gain. Giwa et al [108] simulated the economic and environmental cost of a batch solar pyrolysis system producing biocarbon from date palm. They estimated 185 gCO2/kWh for solar concentration system, which halved the consumption as compared to electrical-driven pyrolysis (450 gCO2/kWh). The use of solar shows also a significant gain in CO2 emission saving. The next section presents preliminary energy assessment of all the processes.
5. Energy assessment
Three processes to produce non-graphitizable lignocellulosic biomass into graphenic materials have been discussed. Their limitations are linked to either scalability or high temperature graphenization. Thus, energy saving can be achieved by either lowering temperature through catalysis or pre-treatment, or with a renewable energy input. The proposed routes allow the production of graphenic material to better suit the variety of applications that such materials could offer.
The choice of process or their combination should be guided not only by application but also by environmental consideration. Life-Cycle Assessment (LCA) and Technico-Economic Assessment (TEA) are used to evaluate the value chain of biocarbon [109], [110]. These evaluations provide a useful comparison between processes for a similar final product and will be used here to quantify theoretical energy savings. This approach is covered in this section.
5.1. Life cycle assessment
Life Cycle Assessment (LCA) is a methodology assessing environmental impacts throughout the life of a product, process or service [111].
LCA starts with the definition of scope and boundaries. The second step of Life Cycle Inventory (LCI) quantifies inputs and outputs. Third is the impact assessment (LCIA) which evaluates to what extent a product impacts the environment during its life cycle. Finally results are interpreted in regard to the initial scope to draw conclusions and recommendations [112].
The four phases of a graphenic biocarbon LCA were described in few articles [109], [110], [113], [114]. The scope and goal definition are important to determine the limitations and the focus of the study. In the present review, the goal is to compare different processes leading to the same biocarbon chemistry. Thus, the graphenic biocarbon system boundary is limited to seven main steps: 1) feedstocks collection; 2) its transportation to the conversion plant; 3) a pre-treatment process; 4) a high temperature treatment; 5) transportation of final biocarbon produced; 6) usage and 7) end of life. In this LCA, four scenarios will be reviewed depending on the process and are named S1 (conventional pyrolysis in electric furnace), S2 (addition of catalyst in S1), S3 (hydrothermal carbonization and conventional pyrolysis) and S4 (solar pyrolysis without catalyst). The goal for each scenario is the production of 1 kg of graphenic biocarbon (functional unit). The main estimates for each scenari we proposed are summarized in Fig. 10.
 Fig. 10
Inputs considered in this system include energy for thermal treatment, fuel for transportation, water demand (cooling systems, wet catalyst impregnation, HTC) and any supplementary material (catalyst, other chemicals, gas for pyrolysis). Outputs are emissions (to air or water), heat loss and waste. To quantify each input and output, estimated values found in the literature were linked to specific process conditions and scope, which might be different from the present scope. Estimations are given when relevant in the following sections.
5.1.1. Scenario 1, conventional pyrolysis
First case is high temperature biomass conversion into biocarbon using conventional pyrolysis with electrical heating.
The first step is the feedstock collection. One important part here is the initial quantity of lignocellulosic biomass to produce 1 kg of graphenic biocarbon. Basically, LCA studies of lignocellulosic biomass estimated a biocarbon yield from 15 % to 30 % [109], [115], [116]. Although those estimations are determined at temperatures below 1000 °C, where most of the mass loss occurs [117], this is consistent with mass balance at higher temperatures [118]. Thus, with a biocarbon yield of 15 %, we calculated that 6.7 kg of initial lignocellulosic biomass are required to produce 1 kg of biocarbon through conventional pyrolysis at 2000 °C.
Regarding the two transportation steps – from the collected lignocellulosic biomass crop to the conversion plant (step 2) and from there to the usage (step 5) – the estimations are valid for the four scenarios. The size of the vehicle, the distance traveled, and the fuel consumption should be taken into account. The vehicle type influences the type and quantity of emissions. For example, a heavy-diesel truck consuming 31.6 L/100 km and driving over 25 km consumes 7.9 L (input data). This corresponds to 21.47 kg CO2e (output data), corresponding to the fossil fuel combustion of this vehicle (2718 g CO2e.L-1) [116].
Once at the plant, the feedstock will go through some pre-treatments (step 3). For this first scenario as well as in S2 and S4, pre-treatment includes drying and grinding. Energy demand of biomass drying was estimated at 3.5 MJ/ kg, for moisture reduction from 15 wt% to 7 wt% according to the literature [116]. Grinding energy has been evaluated at 2.16 MJ/ kg [109] or could be estimated through Rittinger equation which depends on the initial and final sizes [119]. All these estimations depend on the equipment and biomass (type, moisture) selected. However, they could be taken as such since no optimization is targeted in latter scenarios.
The high temperature treatment in S1 (step 4) is pyrolysis in an electrical furnace in N2 atmosphere at 2000 °C. The energy calculations for this scenario will be the reference data used for comparison. The details will be presented in the next section.
Regarding the usage of biocarbon (step 6), several applications are possible. Soil amendment is often targeted as an environmentally and economically advantageous application [120]. The high specific surface area and high conductivity of graphenic biocarbon are better suited for supercapacitor applications. The LCA of a graphene-based supercapacitor has been proposed, with usage in a medium car for at least the lifetime of the vehicle (150,000 km) [114]. The input is the fuel consumption allocated to transport of such supercapacitor. Other applications such as batteries (Li-ion or Na-ion), environmental sensors or pollutant sorbents would have different environmental impacts [121].
At the end of life (step 7), a recycling route is proposed for graphene recovery and reuse. They studied two unsustainable production processes: electrochemical exfoliation of natural graphite and reduced graphene oxide from graphite powder [114], [122]. This highlights the importance of a more efficient graphene production with lower environmental impacts.
For the four scenarios investigated, we consider the use of graphenic material for supercapacitor and the corresponding end of life scenario.
To sum up, thermoconversion processes likely represents the highest electricity consumption, and is the target for improvements in environmental performances [123]. Thus, the focus is on production step rather than usage or end of life. For S1, during pre-treatment and treatment, one of the main inputs is electrical energy and hence an important impact on global warming and other indicators. This significant energy demand is due to the endothermicity of pyrolysis and the high temperature (more than 2000 °C) for a long period (hours) required to convert biomass into graphenic biocarbon. Therefore, the recommendation is using a less energy-intensive thermoconversion process.
5.1.2. Scenario 2, catalytic graphenization
To reach less energy-intensive pyrolysis, catalytic pyrolysis is considered for alternative scenario S2. Production route is identical to S1, with additional inputs and outputs linked to the catalyst. The origin of catalyst, its extraction, transportation and associated emissions are considered part of the background activities and are indirect burdens here [124]. The catalyst selection is crucial for its impact on energy demand and air emissions. A study on LCA of metals extraction revealed a low impact of Ca extraction across five impact categories compared to Fe, Co or Ni [125].
Nickel and cobalt [13], [14], [15], [48] are mostly used as nitrate form for biomass wet impregnation which are harmful and nature polluting. Iron is less toxic, available and has a similar, if not better, catalytic effect. An acid leaching step is usually done after graphenization with transition metal catalysts. Calcium catalyst is nontoxic, and has lower environmental impact than transition metals [51]. During graphenization, calcium particles volatilize above 1400 °C [51]. Calcium is selected as graphenization catalyst in scenario S2 to avoid leaching step and impacts associated with extraction, toxicity and emissions. Based on the catalyst to biomass ratio of Béguerie et al [51], catalyst represent 3.02 kg input with 6.7 kg of biomass. The impregnation process with inputs and outputs of water as well as the gas emission of catalytic pyrolysis should be investigated. Another difference between S1 and S2 is the pyrolysis temperature. Biocarbon produced at 1400 °C with calcium catalyst presented highly crystalline graphenic structures. At 1600 °C, no calcium species were detected [51]. When working in a similar furnace than in S1 at 1600 °C instead of 2000 °C, the save in energy consumption will positively impact the overall system. A first approximation of energy saving is achieved using the enthalpy balance [126], as defined in Equation (3) where
Equation (3): Heat of pyrolysis
The enthalpy inflow includes enthalpy of the feedstock (
Equation (4): Enthalpy of nitrogen function of temperature, its mass
Based on our calculations, heat required at 1600 °C decreased by 22 % compared to 2000 °C. The selection of process parameters and specifically temperature is thus crucial [128]. Nevertheless, energy saving should be balanced with the biocarbon properties and structure at the graphenization temperature towards the targeted application.
5.1.3. Scenario 3, hydrothermal carbonization pre-treatment
Combination of hydrothermal carbonization as pre-treatment with pyrolysis for graphenic structuration is the third scenario (S3). HTC has a supplementary energy input compared to other scenarios, which can be minimized using the severity factor and the exothermicity of those reactions. Hydro-biocarbon should be filtered and dried prior to pyrolysis. Energy input for drying is expected to be higher in this scenario with an estimated moisture content of 30 wt% after filtration [115]. The hydro-biocarbon is more stable and contains less volatiles than initial biomass. This will have an influence on gas emission during pyrolysis and on the initial mass. Indeed, mass loss of hydro-biocarbon at 800 °C reached 45.5 % from thermo-gravimetric analysis [70]. Thus, the production of 1 kg of biocarbon would need 1.8 kg of hydro-biocarbon. Hydro-biocarbon yield after hydrothermal carbonization varies from 90 to 55 wt% depending on the treatment conditions and the biomass nature [57]. Thus, this two-step process requires about 3.3 kg of initial biomass to produce 1 kg of biocarbon. During HTC, the water to biomass ratio of 10:1 revealed optimum for biomass polymers decomposition [54]. This would add a water input of 33 L in our inventory. When using the combination of processes, the pyrolysis temperature is set between 700 °C and 1200 °C [70], [82] and can sometimes use additional catalysts [129], [130]. The mass needed for pyrolysis step in S3 (1.8 kg) is four times lower than S1 (6.7 kg). Thus, the mass of nitrogen
5.1.4. Scenario 4, solar pyrolysis
For the fourth scenario, solar energy is selected for high temperature treatment, cutting all the electrical energy inputs in the production step and strongly reducing the impact of electricity usage. In this scenario, the mass loss for fast solar pyrolysis at temperatures over 1200 °C is around 90–92 % [95]. We estimate that 10 kg of initial biomass will be transformed into 1 kg of graphenic solar biocarbon. However, fast pyrolysis favors gas production and thus the emissions from production step are affected. Fig. 10 summarizes our main estimates made for the four scenarios, by focusing on the electrical energy required for the biomass to biocarbon transformation step. It is worth noticing that a certain number of assumptions were made to obtain those estimations.
5.2. Techno-economic assessment
The technical and economic analysis (TEA) of a product, process or service is another indicator for the evaluation of system viability. The goal of such assessment is the optimization of existing technologies. In that regard, a TEA of the three processes studied (conventional pyrolysis, HTC and pyrolysis, solar pyrolysis) provides useful insight on their practicability, costs and risks associated. Technological feasibility and economic profitability are evaluated in a gate-to-gate assessment. Costs are associated to the biomass supply, its transportation and the location of the thermal treatment system [131]. Zimmerman et al [132] highlighted the importance of location of a biomass conversion plant close to the source of biomass and to the road and rail networks. Indeed, cost items studied in TEA can include feedstock costs [133], transportation costs [134], [135], supply chain [136], [137] or production scale [138], [139] among others. Indicators for existing or future project are internal rate of return (IRR)[140], net present value of profit (NVP) [141], return on investment (ROI) or payback time (PBT) [108]. Giwa et al [108] used those indicators to assess solar pyrolysis of date palm. Their comparison of electrical and solar heating in terms of economic indicators is summarized in Table 4.
| Economic indicators | Biochar with solar heating | Biochar with electrical heating |
|---|---|---|
| Total capital investment ($) | 6,306,000 | 5,922,000 |
| Capital investment charged to this project ($) | 6,306,000 | 5,922,000 |
| Operating cost ($) | 2,691,000 | 2,824,000 |
| Revenue ($) | 4,171,000 | 4,171,000 |
| Basis annual rate (kg/y) | 1,681,680 | 1,681,680 |
| Unit production cost ($/ kg) | 1.6 | 1.68 |
| Net unit production cost ($/ kg) | 1.6 | 1.68 |
| Unit production revenue ($/ kg) | 2.48 | 2.48 |
| Gross margin (%) | 35.49 | 32.29 |
| ROI (%) | 22.94 | 22.46 |
| PBT (y) | 4.36 | 4.45 |
| IRR after taxes (%) | 14.77 | 14.14 |
| NVP at 7.0 % discount ($) | 3,479,000 | 3,023,000 |
Reproduced from [108]
One of the highlighted indicators is the ROI, which gives information on the performance of process and efficiency of the investment. The slightly better ROI of solar plant compared to electrical plant is one of the reasons supporting this process economic viability and competitivity. Similar studies are scarce but needed to provide guidance in future research investment.
This section only provided basics on the methodology of TEA for graphenic biocarbon production. Many hypotheses should be included to go through calculations. Taking only the thermoconversion process as a difference, conventional pyrolysis processes are more developed at industrial scale to lower the investments. Therefore, catalytic graphenization could be easily handled in those processes. However, in day-to-day operations perspectives, energy consumption is the main criteria that could be lowered by solar energy supply or lower operation temperature. Rigorous calculations require more experimental data to establish an energy balance that includes energy losses. Research on graphenic material production from bioresource will benefit from assessing processes through a LCA and TEA lens.
6. Recommendations
Processes reviewed for the graphenization of biocarbon have been selected since they produce crystalline graphenic domains, at temperature below 2000 °C, with less environmental impact and economic cost. In summary, the catalyst offers an ideal graphenization site for carbon that organize at pyrolysis temperature below 1600 °C in a mechanism that established the metal carbides as crucial intermediate phases for the graphenization. Environmental and economic costs are highly dependent on the catalyst type and the emerging use of alkaline earth metal is promising to lower them. Hydrothermal carbonization as pre-treatment also follows those criteria: the locally organized hydro-biocarbon through liquid carbonization can produce highly organized biocarbon when further pyrolyzed at around 1200 °C. The weight of combined processes in terms of environmental impact and financial costs have to be put in perspective with the gain of efficiency and quality of biocarbon. A more straightforward energy saving is solar pyrolysis as alternative to electrical pyrolysis. The high energy flux provided by fast solar pyrolysis allows the change of hybridization of carbon from sp3 to sp2. Although high temperatures are easily reached with solar concentration, the apparition of graphitic domains in biocarbon starts at temperatures below 2000 °C. Advantages and limitations of each process are listed in Table 5.
| Graphenization process | Advantages | Limitations |
|---|---|---|
| Catalytic graphenization – Co | Low temperature graphenization (below 2000 °C), high quality graphenic domains. | Toxic catalyst, post treatment for catalyst removal, lack of availability, high environmental impact in the production |
| Catalytic graphenization – Ni | Low temperature graphenization (below 2000 °C), high quality graphenic domains. | Toxic catalyst, post treatment for catalyst removal, lack of availability, high environmental impact in the production |
| Catalytic graphenization – Fe | Nontoxic and earth-abundant catalyst, high quality graphenic domains. | post treatment for catalyst removal |
| Catalytic graphenization – Ca | Nontoxic and earth-abundant catalyst and inherent to biomass (see self-catalysis), no post treatment when used above 1600 °C, high quality graphenic domains. | High ash content |
| Hydrothermal carbonization and pyrolysis | Direct valorization of wet biomass, lowered graphenization temperature, efficient pre-structuration method, tunable porosity, high quality graphenic domains. | Energy demand for two reactors, drying after HTC step |
| Solar carbonization | Green energy source, large domains of possible temperature and heating rates, versatility of reaction atmosphere, high quality graphenic domains. | Intermittent energy source, fumes deposition, temperature gradient, low yield, upscaling limitations |
The choice between processes can be done using several selection criteria. The criteria should be based on the desired characteristics of graphenic biocarbon and on the application targeted.
-
•
Graphenic phase rate: a high quantity of biocarbon can be produced through slow pyrolysis, thus fast solar pyrolysis is not recommended. The quantity of graphenic phase in the biocarbon is highly dependent on the process parameters. To choose between S2 (catalyst) or S3 (hydrothermal pre-treatment), purity should be considered as a second factor. When the mineral content in biocarbon is not an issue or even encouraged, catalytic graphenization is recommended. Otherwise, hydrothermal pre-treatment will offer the highest rate of initial feedstock mass to final mass of biocarbon and the graphenic percentage can be tunned with pyrolysis temperature.
-
•
Graphenic phase quality: high quality graphenic domain is met with high treatment temperature no matter the process. High temperatures can be reached more easily with solar pyrolysis that can also be selected because of its low operation time. High quality is also reached using catalytic graphenization. However, the use of metal catalyst and the need of acid washing might lower purity. Using a catalyst naturally volatilizing during pyrolysis is recommended (example of calcium)
-
•
Feasibility: adapting an existing conventional furnace for catalytic graphenization might be easier than adding a hydrothermal reactor or creating a solar pyrolysis one.
Those criteria are selected to choose the appropriate production route depending on the graphenic biocarbon characteristics and application. The production route can also be a combination of the proposed processes to capitalize on their specific strengths. For example catalytic hydrothermal carbonization followed by pyrolysis has been explored by Demir et al [129] and Nakayasu et al [130]. Other examples like catalytic solar pyrolysis initiated by Zeng et al [94] or solar hydrothermal carbonization by Ischia et al [107] could inspire a two-steps process of hydrothermal pre-treatment and solar pyrolysis graphenization. Overall, a continuous optimization of operating conditions is needed to fit graphenic biocarbon properties to the application. For example, graphenic biocarbon already showed a significant environmental, economic and technical benefit when used as a filler material in plastic [142] or as functional filler for polymer and biocomposites [143].
7. Conclusion
Graphenization of non-graphitizable resource, such as lignocellulosic biomass and its polymers components, is challenging. The main obstacles to overcome are: turning carbon hybridization from sp3 to sp2 and organizing carbons in long and stacked graphenic structures.
The first lever is temperature, however even over 2000 °C there is no guaranty of a graphenic biocarbon fitting the desired application. Three other levers have been reviewed.
First, catalytic graphenization was done using transition metals or alkaline earth metals during slow pyrolysis. The action of catalysts on the graphenization mechanism allows the production of graphenic biocarbons at 1400–1600 °C. The carbon follows a dissolution-precipitation mechanism on the sites of a catalyst particle that enhance its precipitation in graphenic structure. Gaining several hundreds of degrees in the pyrolysis process correspond to energy saving of 22 % (at 1600 °C). The selection of catalyst is crucial depending on targeted application. Using minerals inherently present in lignocellulosic biomass such as calcium present another improvement. Even though the mechanisms of carbon structuration are documented, more in-depth analysis of mechanisms would be necessary. The understanding of which element is better suited as catalyst might be understood using their solubility in carbon and electronegativity. The four graphenization catalysts highlighted in this review (Fe, Co, Ni, Ca) contain two electrons in their 4 s electronic subshell. The interactions during catalysis at the electron scale might give insights on the catalytic or inhibiting influence during carbon graphenization. These insights on catalytic graphenization would enrich both conventional and solar graphenization.
Another lever is hydrothermal carbonization. Hydro-biocarbons are carbon-rich materials with pre-structuration. Those properties are essential when using pyrolysis afterwards to obtain highly graphenic materials. This two-steps process has two main advantages: high solid yield and low pyrolysis temperature. On the pyrolysis step alone, the energy saving could reach 85 % when working at 1200 °C for similar results than the direct pyrolysis at 2000 °C.
Electrical heating for pyrolysis could also be replaced by solar heating. The fast pyrolysis produces less solid than the slow pyrolysis. However, the high energy density provided in a solar reactor will affect the graphenization mechanism. This leverage is suppressing the electrical energy demand for heating when producing graphenic biocarbon.
A limit to those proposed processes is the scalability. The versatility of process conditions and reactors make difficult the design of a conversion plant to produce graphenic material for specific applications. Future prospects can also be found in the diversity of combined processes whether it is with new energies or bi-catalyst for example. The production of solar biocarbon specifically structured for solar thermal energy storage should also be explored
CRediT authorship contribution statement
Salomé Rigollet: Writing – original draft, Visualization. Elsa Weiss-Hortala:Writing – review & editing. Gilles Flamant: Writing – review & editing. Ange Nzihou: Writing – review & editing, Conceptualization.
Declaration of competing interest
The authors declare that they have no known competing financial interests or personal relationships that could have appeared to influence the work reported in this paper.
© 2024 The Authors. Published by Elsevier B.V.