Highlights
-
•
Grewia Optiva, rice husk, and rice husk ash filled composites were fabricated.
-
•
MCDM is used to find the best formulation for automotive braking applications.
-
•
Integrated CRITIC-MARCOS model used to rank the composites.
-
•
Comparison with other MCDM models has been performed.
-
•
The composite containing rice husk ash gained the best rank.
Abstract
The aim of this study is to develop a method for selecting and ranking automotive brake friction composite materials made from agro-waste and natural fibers. This is achieved by using an integrated multi-criteria decision-making methodology. Consequently, six composite samples are produced by reinforcing rice husk, rice husk ash, and Grewia optiva fiber. These samples are then assessed for their frictional properties using a laboratory-scale brake tribometer, in accordance with the requirements outlined in SAE J2522 standard. The selection criteria are based on the analyzed tribological parameters, which include friction coefficients, wear, and friction fluctuations fade-recovery performances. The CRITIC (criteria importance through intercriteria correlation) method was used to determine the importance of criteria for performance evaluation. Based on CRITIC analysis, the average friction coefficient (0.1592), recovery-3 (0.1363), friction fluctuations (0.1347), and performance friction coefficient (0.1240) were identified as the key criteria. The use of MARCOS (measurement of alternatives and ranking according to compromise solution) for ranking assessment reveals that composite materials reinforced with rice husk ash exhibit the most favorable tribological characteristics. The validation of the ranking using different decision-making tools demonstrates the reliability and effectiveness of the proposed approach.
Keywords
Brake friction materials
Rice husk
Natural fiber
Decision-making
CRITIC-MARCOS
1. Introduction
The use of lignocellulosic materials, such as agro-wastes and natural fibers, in the design of brake friction composite materials offers several benefits, including a reduction in reliance on conventional materials and environmental protection [1,2]. However, attaining the appropriate tribological characteristics in a brake friction composite application is a complex task that requires focused endeavors to fulfill the rigorous performance standards established by several regulatory entities [3,4]. These criteria encompass attributes like stable friction, minimal wear, rapid recovery, and limited fade under diverse operating conditions, including vehicle speed, braking force, duration, and temperature variations [5,6]. To achieve these desired performance characteristics, brake friction materials consist of a carefully balanced combination of 10–20 ingredients. These components can be broadly categorized into four classes: fibers, fillers, binders, and friction modifiers [7]. Fiber is a very significant component due to its ability to enhance strength, optimize the tribological characteristics of friction materials, and address the limitations arising from the improper selection of components, hence alleviating intrinsic compositional defects [[8], [9], [10]]. Typically, friction materials use ceramic, metallic, and organic fibers either individually or in various combinations [[7], [8], [9], [10]]. Currently, the conventional reinforcing materials commonly utilized, including, Kevlar fibers, carbon fibers, and glass fibers, exhibit several drawbacks. These drawbacks encompass their non-biodegradability, limited recycling capabilities, potential health hazards when inhaled, high density, substantial energy consumption during manufacturing, and elevated production costs [11,12]. In recent years, there has been a significant focus on life cycle analysis, particularly in relation to composites made from lignocellulosic materials [13,14]. These composites have garnered considerable attention and recognition due to their ability to decrease carbon dioxide emissions over their entire life cycle, in contrast to composites made from synthetic fibers [15]. Furthermore, the manifold advantageous attributes of lignocellulosic materials, including their low density, biodegradability, renewability, cheap or negligible cost, widespread availability, non-toxic and non-abrasive nature, contribute to their high demand in diverse applications [[16], [17], [18]].
In recent years, several research endeavors have been undertaken to explore the potential of using lignocellulosic materials, including agro-wastes and natural fibers, in the production of friction composite materials. Akıncıoğlu et al. [19] compared the sliding wear and friction characteristics of a brake friction composite filled with hazelnut shell waste to a commercially available composite material in their study. The study discovered that the friction characteristics of hazelnut shell waste (7 wt.%) reinforced composites outperform commercial samples. This enhancement, however, comes at the expense of increased wear. Akıncıoğlu et al. [20] conducted a study to investigate the effects of adding walnut shell waste at concentrations of 3.5 wt.% and 7 wt.% on the tribological properties of brake friction composites. The investigation was carried out following the SAE-J661 test standards. The researchers determined that composites containing a lower percentage of walnut shell waste (3.5 wt.%) demonstrate a higher degree of resistance to wear. Conversely, it was demonstrated that composites with a higher proportion (7 wt.%) of walnut shell waste displayed an elevated friction coefficient. Chandradass et al. [21] conducted a study on the development of a new type of brake pad materials for automobiles. More precisely, they incorporated sugarcane bagasse ash into the brake pad composition at concentrations of 5 wt.% and 10 wt.%. The main aim of their investigation was to evaluate the sliding wear and friction properties of these recently manufactured materials. According to the authors' findings, there was a direct correlation between the increase in bagasse ash loading and the increase in wear of the brake pads. Furthermore, it was noted that brake pads containing 5 wt.% of bagasse ash demonstrated improved friction performance in comparison to other loadings. The effectiveness of fly ash and bagasse ash (0–12% by weight) on the performance of phenolic-based automotive brake friction composites was examined by Choosri et al. [22]. The authors stated that in phenolic-based brake friction composites, bagasse ash and fly ash have demonstrated great promise as substitute abrasives for silica and alumina. According to the findings, it was advised to add 4 wt.% of fly ash and bagasse ash to optimize the brake friction composites' overall characteristics.
Among the agro-wastes, rice husk and its ash have been found to be effective in improving the mechanical, tribological, and thermal properties of polymer composites due to their high silica content [[23], [24], [25], [26]]. The raw rice husk was found to have a silica content of 15–20%, whereas rice husk ash was found to contain over 90% silica content [27,28]. Silica is classified as an abrasive and is commonly used as one of the main ingredients in various commercial brake friction material formulations. Literature reports the utilization of rice husk and its ash in the fabrication of automotive brake friction materials. Mutlu [29] conducted a study to examine the relative effectiveness of rice straw and rice husk (at 4% and 20% weight ratios) in real-world brake friction materials. The study determined that the brake material containing 20 wt.% rice husk exhibited superior friction characteristics, albeit at the expense of increased wear. Mutlu and Keskin [30] conducted a study to examine how the addition of rice straw powder (ranging from 5% to 25% of the total weight) affects the wear and friction characteristics of friction composites. The study found that the inclusion of 15 wt.% rice straw powder in composites led to improved wear and thermo-mechanical properties compared to other combinations. The effect of rice husk loadings (from 0% to 12% by weight) on the tribological performance of brake friction materials was studied by Gehlen et al. [31]. The composites' wear resistance decreased with increasing rice husk loadings at lower temperatures (300 °C), while at higher temperatures (550 °C), the fade resistance decreased, and the friction instability increased. The formulation containing 6 wt.% rice husk content was determined to be superior to the others, exhibiting the least amount of wear. Nogueira et al. [32] conducted a study to examine the impact of rice husk (grinded and heat treated) on the tribological properties of phenolic composites. They compared these properties with a formulation that substituted alumina for rice husk. Friction materials that incorporate rice husk (grinded and heat treated) have demonstrated promising characteristics, including a friction coefficient and wear rate that are comparable to those of alumina-based formulations. In general, the use of rice husk and its ash in brake composite formulations has been shown to enhance the stability of friction performance by creating secondary contact plateaus [33,34].
In recent years, researchers have examined natural fibers as potential environmentally-friendly reinforcing elements for automotive brake friction materials. Ramie, hemp, kenaf, pineapple, Areva javanica and banana are just some of the plants that have been tried and tested [[35], [36], [37]]. The friction and wear performance exhibited by natural fiber reinforced composites is demonstrated to be satisfactory, often approaching that of standard commercial friction materials, thereby indicating their comparable braking power. Rajan et al. [38] assessed phenolic composites filled with slag waste and reinforced with coir fiber (5%–20% by weight). The researchers documented that incorporating a lower amount of coir fiber (5 wt.%) resulted in favorable outcomes in terms of friction, fade, and wear. In contrast, composites containing a greater weight percent (20 wt.%) of coir fiber demonstrated exceptional recovery characteristics, albeit at the expense of reduced friction performance. The impact of corn stalks fiber (ranging from 4% to 12% by weight) on the fade-recovery capabilities of brake composites reinforced with glass fiber were investigated by Liu et al. [8]. According to the authors, the composite containing 6 wt.% corn stalk fiber has the greatest recovery ratio and the lowest fade ratio, whereas the composite containing 10 wt.% corn stalk fiber demonstrated a comparatively low fade/recovery fluctuation. Composites containing the smallest proportion of corn stalk fiber (4 wt.%) demonstrated the most unfavorable friction behavior in the fade test. The research suggested that composites containing 10 wt.% corn stalk fibers demonstrated exceptional recovery and resistance to fading, as well as a high degree of frictional stability throughout the fade and recovery tests. Furthermore, numerous studies have been conducted on the impact of brake friction materials that include a natural fiber content of up to 20 wt.%. In these studies the composites containing a lower proportion of natural fibers (≤10 wt.%) have been found to demonstrate higher coefficients of friction, better fade performance, greater friction stability, and improved wear resistance, with minimal fluctuations in friction. Conversely, composites containing a higher proportion of natural fibers (≥15 wt.%) demonstrate superior recovery performance, albeit at the expense of reduced friction and fade performance [[37], [38], [39]].
The existing research places a growing emphasis on the fact that the choice of lignocellulosic materials and their respective ratios typically have an impact on the tribological characteristics (such as coefficient of friction, wear, fade, and recovery) of the composite material. Given that each produced composite has a unique performance characteristic, it is necessary to determine the optimal composite that exhibits the maximum degree of satisfaction across all material attributes [40]. One way to do this is by use multi criteria decision making (MCDM) techniques. MCDM techniques are systematic approaches that use logical ways to assess the significance of criteria (i.e., material attributes) in relation to a specific application [41,42]. These techniques aid in selecting the most acceptable material candidate and eliminating inappropriate alternatives. Several MCDM techniques have been created to assist in the evaluation and selection of the most suitable alternative materials. These approaches include TOPSIS, MARCOS, COPRAS, GRA, PROMETHEE, MOORA, ELECTRE, CoCoSo, and ARAS, among others [[40], [41], [42], [43], [44], [45], [46], [47]]. The MARCOS methodology stands out as an effective ranking method due to its straightforward mathematical computations and user-friendly nature, in comparison to other MCDM techniques [48]. Conversely, specific MCDM problems utilize the CRITIC method to determine the weights of criteria (material property importance) [49]. Ranking alternatives is thus possible through the utilization of these two approaches. Hence, automotive brake friction materials reinforced with rice husk and Grewia optiva fiber, which were previously manufactured and evaluated for their tribological properties, were utilized in the current investigation [34,39]. Owing to the challenges associated with choosing the best-manufactured automotive brake friction composites, a hybrid approach known as CRITIC-MARCOS has been suggested. The evaluated tribological characteristics are set as the selection criteria, the criterion weight is determined using CRITIC and the final composite ranking is obtained using the MARCOS technique.
2. Experimental procedure
2.1. Materials and composite fabrication
A total of twelve ingredients were chosen for the production of the friction composite. These include phenolic resin as a binder, lapinus fiber, steel fiber, ceramic, and Grewia optiva fiber as the reinforcement, calcium carbonate and barite as space fillers, alumina and graphite as property modifiers, and vermiculite, rice husk, and rice husk ash as functional fillers. The Grewia optivafiber used in this study originates from the Dehlwin village situated in the Bilaspur area of Himachal Pradesh, India. The natural fiber was hand trimmed to fiber lengths ranging from 2 to 6 mm. The rice husk was gathered from the southern area of Brazil. The rice husk was further pulverized to achieve a particle size of ≤350 μm. To acquire the ash, the rice husk underwent a heating process at a temperature of 600 °C for duration of 2 hours in an oven equipped with air circulation. This procedure was carried out to eliminate all the organic compounds present. The outcome of this procedure was rice husk ash, rich in silica content characterized by its white powdery form.
Table 1 lists the several friction formulations and their component amounts along with their nomenclature and composition data. It is worth noting that there are two main groups of formulations, each sharing the same basic materials. The group I comprises formulations A1 to A4, where the amount (in wt.%) of ceramic and Grewia optiva is changed. The group II comprises formulations A5 and A6, where the type of natural abrasive (rice husk or rice husk ash) is changed. The ingredients of the formulations of group I were mixed using a high rotation shear mixer (Fabdecon Engineers, India) with a chopper speed of 3000 rev/min. To reach a uniform dispersion, the fibrous elements were blended with phenolic resin for 5 minutes, and then the powdered materials were added and mixed for a further 5 minutes. Next, 80 g of the resulting mixture was put into an iron mold. The prepared mold was heated for 8 minutes at 155 °C under 150 bar of pressure in a compression molding machine made by Fabdecon Engineers, India. To get rid of the volatiles created during the cure process; compression molding was done with four sporadic breathing cycles. After being taken out of the mold, the cured composites were allowed to cool at ambient temperature before being post-cured in an oven at 160 °C for 3h. For the formulations of group II, rice husk was thermally treated for two hours at 110 °C before being added to the mixture, to ensure the release of all moisture. After that, all the ingredients of each formulation were blended for 30 minutes using a WAB T2F Turbula mixer. By utilizing a Buehler Pneumet I mounting press, cylindrical pins measuring 14 mm in diameter and 15 mm in height were created. A pressure of 100 MPa was applied during the 10-minute hot molding operation at 150 °C. The pins were then subjected to a post-curing procedure in a muffle furnace for 4 hours at 200 °C, which is close to the cycle used for genuine brake pads. The fabrication methodology is described in full elsewhere [34,39]. Subsequently, all the post-cured composites were subjected to machining, resulting in specimens with a cylindrical shape, each cylinder with a diameter of 14 mm and a height of 7 mm. These specimens were then securely attached to a backplate (Fig. 1a), enabling their use in tribological testing. Fig. 2b displays a scanning electron microscope (SEM) picture of the fabricated composite, indicating the existence of several primary components.
| Materials (wt.%) | Nomenclature/Alternatives | |||||
|---|---|---|---|---|---|---|
| A1 | A2 | A3 | A4 | A5 | A6 | |
| Phenolic resin | 10 | 10 | 10 | 10 | 12 | 12 |
| Barite | 50 | 50 | 50 | 50 | 30 | 30 |
| Calcium carbonate | 0 | 0 | 0 | 0 | 23 | 23 |
| Graphite | 6 | 6 | 6 | 6 | 8 | 8 |
| Alumina | 3 | 3 | 3 | 3 | 6 | 6 |
| Vermiculite | 5 | 5 | 5 | 5 | 0 | 0 |
| Steel fiber | 6 | 6 | 6 | 6 | 15 | 15 |
| Lapinus fiber | 10 | 10 | 10 | 10 | 0 | 0 |
| Ceramic fiber | 7.5 | 5 | 2.5 | 0 | 0 | 0 |
| Grewia optiva fiber | 2.5 | 5 | 7.5 | 10 | 0 | 0 |
| Rice husk | 0 | 0 | 0 | 0 | 6 | 0 |
| Rice husk ash | 0 | 0 | 0 | 0 | 0 | 6 |
 Fig. 1
 Fig. 2
2.2. Tribological characterization
The experiments were carried out in an LSBT (laboratory-scale braking tribometer). This apparatus replicates the working conditions (temperature, velocity, and contact pressure) encountered in actual vehicle braking systems [50]. The LSBT controls the starting temperature of each braking operation through an induction heating system, as can be seen on Fig. 2. This apparatus continually measures the temperature using a K-type thermocouple embedded in the brake disc and calculates the coefficient of friction (COF) throughout the entire testing procedure [51].
The tribological characterization followed the requirements of the SAE J2522 (AK Master) standard for brake pads. The brake industry uses this methodology all around the world since it can assess the performance of a brake material in a variety of circumstances. The sections of the procedure are listed in Table 2[52]. The AK Master test was carried out for three samples of each formulation (A1 to A6), in a total of eighteen tests. A comprehensive examination of the wear mechanisms and surface structures of the friction composites was achieved by analyzing images of the samples' worn surfaces. The scanning electron microscope (SEM, TM3000 Tabletop Microscope-Hitachi) was utilized to obtain those images.
| Section | Description |
|---|---|
| 1. Green characteristic | Applications = 30, pressure = 30bar, Initial brake temperature (IBT) = 100 °C, speed = 80-30km/h |
| 2. Burnish | Applications = 64, pressure = 15–51 bar, IBT = 100 °C, speed = 80-30 km/h |
| 3. Characteristic value | Applications = 6, pressure = 30 bar, IBT = 100 °C, speed = 80-30 km/h |
| 4.Speed/pressure sensitivity (SPS) | Applications = 8, pressure = 10–80 bar, IBT = 100 °C, speed = 40-5 km/h |
| Applications = 8, pressure = 10–80 bar, IBT = 100 °C, speed = 80-40 km/h | |
| Applications = 8, pressure = 10–80 bar, IBT = 100 °C, speed = 120-80 km/h | |
| Applications = 8, pressure = 10–80 bar, IBT = 100 °C, speed = 160-130 km/h | |
| Applications = 8, pressure = 10–80 bar, IBT = 100 °C, speed = 200-170 km/h | |
| 5. Characteristic value | Applications = 6, pressure = 30 bar, IBT = 100 °C, speed = 80-30 km/h |
| 6. Cold | Applications = 1pressure = 30 bar, IBT = 40 °C, speed = 40-5 km/h |
| 7. Characteristic value | Applications = 18, pressure = 30 bar, IBT = 100 °C, speed = 80-30 km/h |
| 8. Fade 1 | Applications = 15, deceleration = 0.4 g, IBT = 100–550 °C, speed = 100-5 km/h |
| 9. Recovery 1 | Applications = 18, pressure = 30 bar, IBT = 100 °C, speed = 80-30 km/h |
| 10. Temperature/pressure sensitivity (TPS) | Applications = 8, pressure = 10–80 bar, IBT = 100 °C, speed = 80-30 km/h |
| Applications = 9, pressure = 30 bar, IBT = 100–500 °C, speed = 80-30 km/h | |
| Applications = 8, pressure = 10–80 bar, IBT = 500 °C, speed = 80-30 km/h | |
| 11. Recovery 2 | Applications = 18, pressure = 30 bar, IBT = 100 °C, speed = 80-30 km/h |
| 12. Fade 2 | Applications = 15, deceleration = 0.4 g, IBT = 100–550 °C, speed = 100-5 km/h |
| 13. Recovery 3 | Applications = 18, pressure = 30 bar, IBT = 100 °C, speed = 80-30 km/h |
2.3. CRITIC-MARCOS optimization
2.3.1. CRITIC method
The CRITIC method employs criteria dispersion and conflict intensity as considerations for weighting. The degree of dispersion quantifies the extent to which evaluation criteria may vary significantly. The degree of conflict is indicative of the degree of similarity between the various criteria. A higher degree of dispersion and disagreement amongst criteria calls for a greater weight. The steps below are used to carry out the CRITIC method [49,53].
-
Step 1
The first step in decision-making is to construct a matrix. A decision matrix is created by defining a collection of p alternatives and q criteria, which are included in multi-criteria models as follows.
-
Step 2
Decision-matrix is normalization. The structured decision-matrix is normalized for the beneficial () and non-beneficial () criteria:
-
Step 3
The standard deviation () of each criterion determined to measure the dispersion degree using following equation:
-
Step 4
Calculation of conflict degree between criterion using following equation.
-
Step 5
Weight calculation
The formula for j-th criterion weight calculation is given as:(6)
2.3.2. MARCOS method
The MARCOS MCDM tool was presented by Stević et al. [48] for the purpose of healthcare supplier prioritization. The MARCOS model is used to tackle a variety of decision-making challenges because of its easy calculation [[54], [55], [56]]. The following are the steps of the MARCOS method [[54], [55], [56]].
-
Step 1
Formation decision-making matrix. The initial decision matrix () is extended by adding the ideal value (IV) and anti-ideal value (AIV) and given as.
The IV and AIV are determined based on the following equations.(8)(9)
-
Step 2
The updated decision matrix normalized in the range of 0–1 using following equations.
-
Step 3
Weighted normalized decision matrix is constructed using following equation.
-
Step 4
Calculation of sum of the weighted matrix values using following equation.
-
Step 5
Calculation of the utility degree of alternatives. In relation to IV and AIV, the utility degrees are determined using following equations.
-
Step 6
Concerning the IV and AIV the utility functions are calculated using following equations.
-
Step 7
The determination of final utility function of alternatives using following formula.
-
Step 8
Ranking the alternatives. The alternatives are ranked from best to worst by descending order of their values.
3. Results and discussion
3.1. Tribological results of the composites
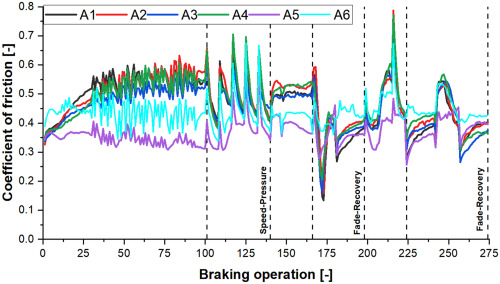
3.1.1. μP and wear results
The coefficient of friction (COF) results of the composites by the application of 274 braking in total for different sections (listed in Table 2) are shown in Fig. 3. Significant fluctuations in COF are evident throughout the SPS braking section (braking instance #101 to #140), as well as from braking instance #173 to the conclusion of the test (braking instance #274). Braking instance #173 to #274 belongs to sections that are specifically connected to the high temperature sensitivity section.
